Introduction to the Course

Nhập môn Mô hình tuyến tính với Python

Jason Vestuto

Data Scientist

Introduction to Chapter 1

Chapter Roadmap:

  • Motivating Examples
  • Data Visualization
  • Descriptive Statistics
Nhập môn Mô hình tuyến tính với Python

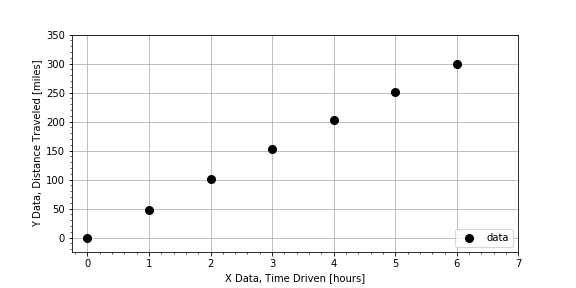
Example Trip Data

Plot of points, Distance versus Time, miles versus hours

Nhập môn Mô hình tuyến tính với Python

Models as Descriptions

# Range of y data, in miles
y_range = np.max(y) - np.min(y) = 300 - 0 = 300
# Range of x data, in hours
x_range = np.max(x) - np.min(x) = 6 - 0 = 6
# Estimating the speed
mph = y_range / x_range = 300 / 6 = 50
Nhập môn Mô hình tuyến tính với Python

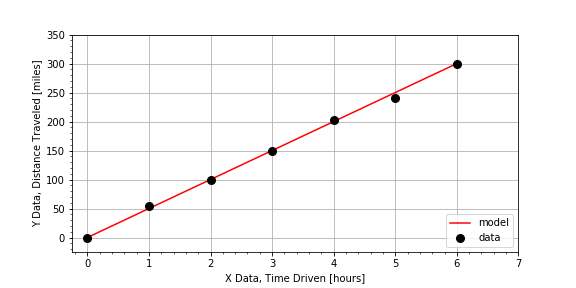
Visualizing a Model

Plot of data and model, distance versus time

Nhập môn Mô hình tuyến tính với Python

Model Predictions

# Model as python expression
miles = 50*hours
# Model predicts distance is 300 miles at 6 hours
time = 6
distance = 50 * time = 50 * 6 = 300
def model(time):
    return 50*time

predicted_distance = model(time=10)
Nhập môn Mô hình tuyến tính với Python

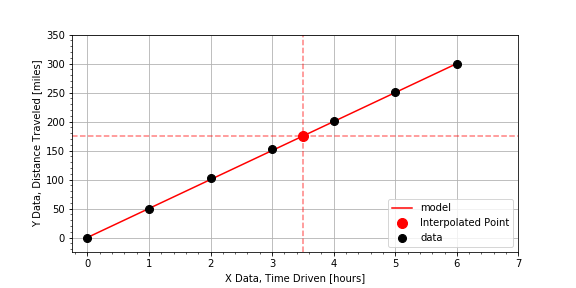
Interpolation

Plot of distance versus time, with interpolation point marked between two data points

Nhập môn Mô hình tuyến tính với Python

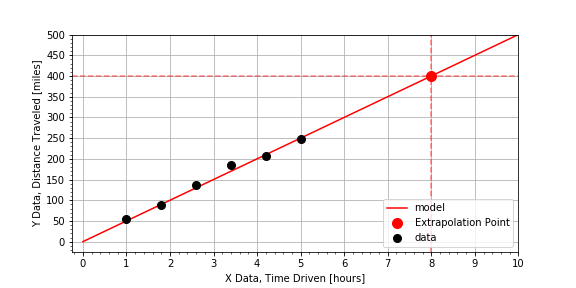
Extrapolation

Plot of distance versus time, with extrapolation point marked outside data points at greater time

Nhập môn Mô hình tuyến tính với Python

Let's practice!

Nhập môn Mô hình tuyến tính với Python

Preparing Video For Download...