What makes a model linear

Nhập môn Mô hình tuyến tính với Python

Jason Vestuto

Data Scientist

Taylor Series

Things to know:

  1. approximate any curve
  2. polynomial form: y = a0 + a1*x + a2*x**2 + a3*x**3 + .... + an*x**n
  3. often, first order is enough: y = a0 + a1*x
Nhập môn Mô hình tuyến tính với Python

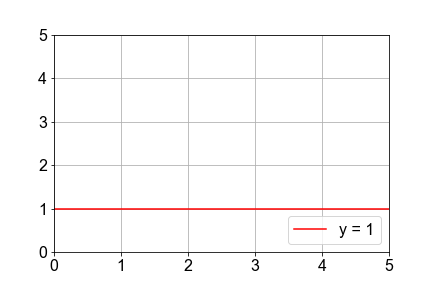
Series Terms: a0=1

Plot of a constant y=1 line with slope zero

Nhập môn Mô hình tuyến tính với Python

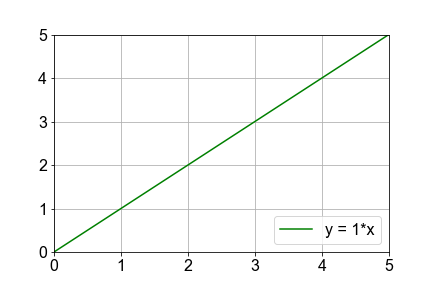
Series Terms: a1=1

Plot of line with nonzero slope y = 1*x

Nhập môn Mô hình tuyến tính với Python

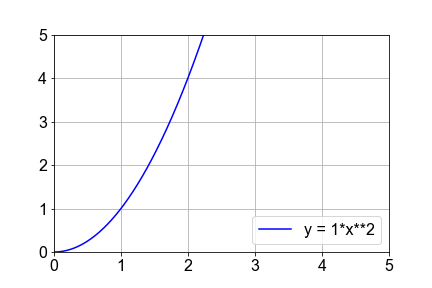
Series Terms: a2=1

Plot of quadratic line y = x^2, half a parabola, up turned

Nhập môn Mô hình tuyến tính với Python

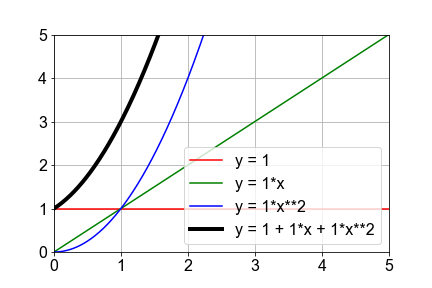
Combining all Terms

Plot of 4 curves, y=1 in red, y=x in green, y=x^2 in blue, and the sum of those three, in black

Nhập môn Mô hình tuyến tính với Python

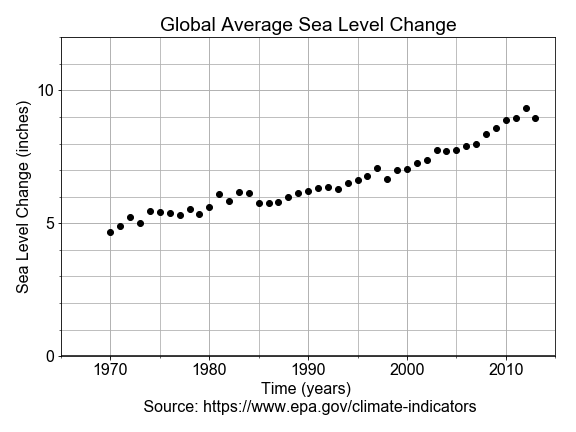
Real Data

Scatter plot of sea level change versus time in years

Nhập môn Mô hình tuyến tính với Python

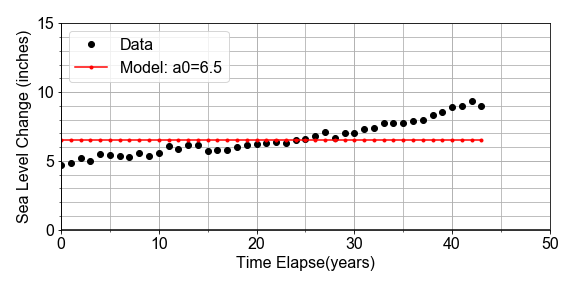
Zeroth Order

Scatter plot of data, sea level versus time, and line plot of model y=6.5, the mean of the data

Nhập môn Mô hình tuyến tính với Python

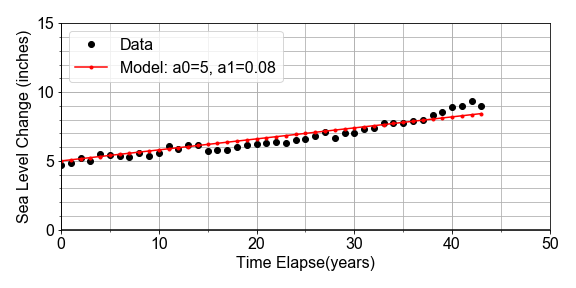
First Order

Scatter plot of data, sea level versus time, and line plot of model y=5 + 0.08*x, with the model line passing through most data points

Nhập môn Mô hình tuyến tính với Python

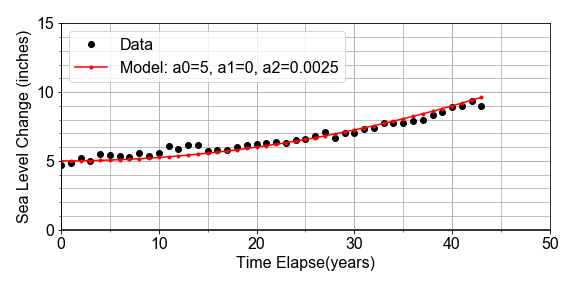
Higher Order

Scatter plot of data, sea level versus time, and line plot of model y=5 + 0.08*x + 0.0025*x^2, with the model line fitting data points

Nhập môn Mô hình tuyến tính với Python

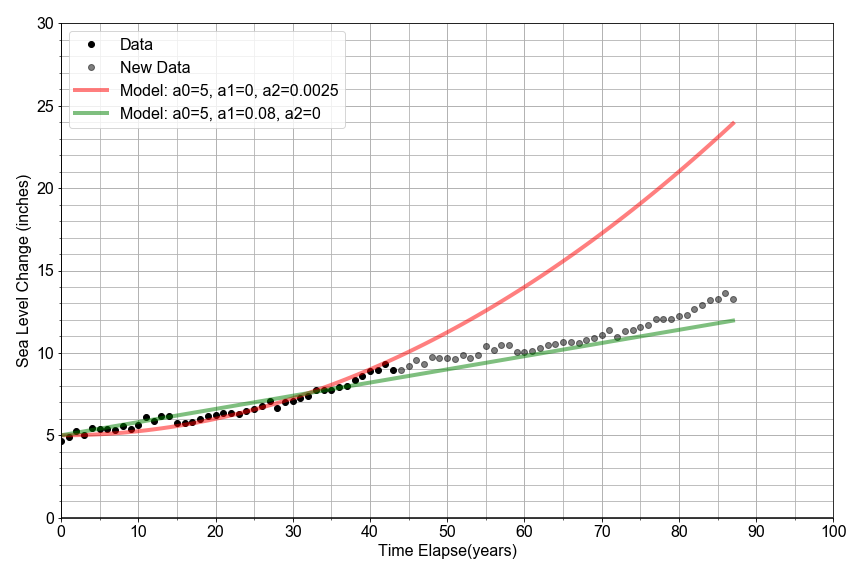
Over-fitting

Scatter plot of data sea level versus time, twice as far in time, with 2 models, line plot y=6.5 + 0.08x fitting data well, and line plot of model y=5 + 0.08*x + 0.0025*x^2, deviating strongly at later times

Nhập môn Mô hình tuyến tính với Python

Let's practice!

Nhập môn Mô hình tuyến tính với Python

Preparing Video For Download...