Khung dự đoán với tập validation

Mô hình hóa với dữ liệu trong Tidyverse

Albert Y. Kim

Assistant Professor of Statistical and Data Sciences

Cách tiếp cận tập validation

Dùng hai tập dữ liệu độc lập để:

  1. Huấn luyện/fit mô hình
  2. Đánh giá sức mạnh dự đoán, tức là validate mô hình
Mô hình hóa với dữ liệu trong Tidyverse

Chia tập huấn luyện/kiểm tra

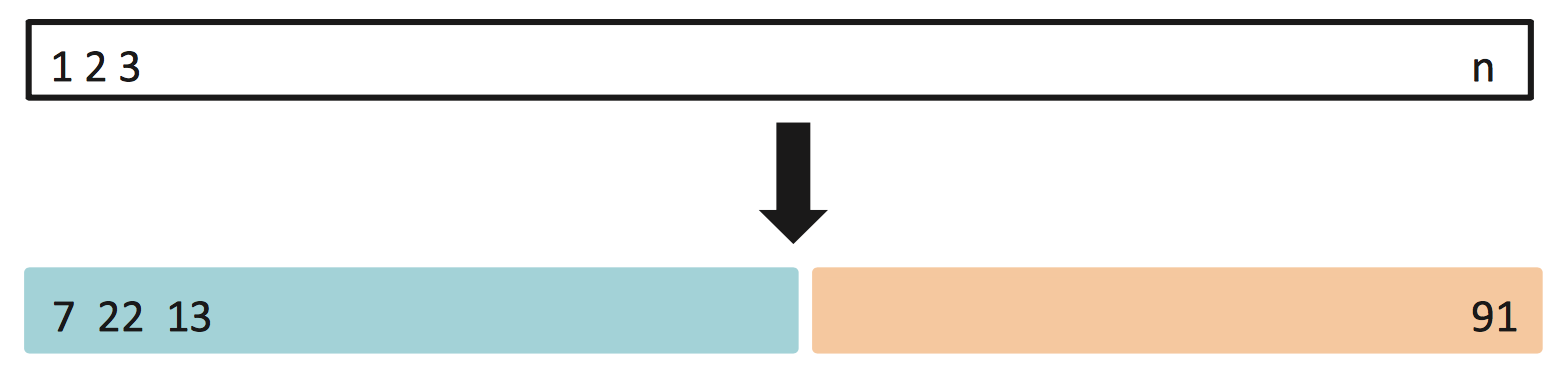
Chia ngẫu nhiên toàn bộ $n$ quan sát (màu trắng) thành

  1. Một tập huấn luyện (màu xanh) để fit mô hình
  2. Một tập kiểm tra (màu cam) để tạo dự đoán
Mô hình hóa với dữ liệu trong Tidyverse

Chia tập huấn luyện/kiểm tra trong R

library(dplyr)

# Randomly shuffle order of rows:
house_prices_shuffled <- house_prices %>% 
  sample_frac(size = 1, replace = FALSE)

# Split into train and test: train <- house_prices_shuffled %>% slice(1:10000) test <- house_prices_shuffled %>% slice(10001:21613)
Mô hình hóa với dữ liệu trong Tidyverse

Huấn luyện mô hình trên tập huấn luyện

train_model_price_1 <- lm(log10_price ~ log10_size + yr_built,
                          data = train)

get_regression_table(train_model_price_1)
# A tibble: 3 x 7
  term       estimate std_error statistic p_value lower_ci...
  <chr>         <dbl>     <dbl>     <dbl>   <dbl>    <dbl>...
1 intercept     5.34      0.111      48.3       0    5.13...
2 log10_size    0.923     0.009      97.5       0    0.905...
3 yr_built     -0.001     0         -23.0       0   -0.001...
Mô hình hóa với dữ liệu trong Tidyverse

Tạo dự đoán trên tập kiểm tra

# Train model on train:
train_model_price_1 <- lm(log10_price ~ log10_size + yr_built,
                          data = train)

# Get predictions on test:
get_regression_points(train_model_price_1, newdata = test)
# A tibble: 11,613 x 6
      ID log10_price log10_size yr_built log10_price_hat...
   <int>       <dbl>      <dbl>    <dbl>           <dbl>...
 1     1        5.83       3.29     1951            5.71...
 2     2        5.88       3.40     1922            5.84...
 3     3        6.15       3.67     2002            5.99...
 4     4        5.62       3        1953            5.43...
...
# ... with 11,603 more rows
Mô hình hóa với dữ liệu trong Tidyverse

Đánh giá dự đoán bằng RMSE

# Train model:
train_model_price_1 <- lm(log10_price ~ log10_size + yr_built,
                          data = train)

# Get predictions and compute RMSE:
get_regression_points(train_model_price_1, newdata = test) %>%
  mutate(sq_residuals = residual^2) %>%
  summarize(rmse = sqrt(mean(sq_residuals)))
# A tibble: 1 x 1
   rmse
  <dbl>
1 0.165
Mô hình hóa với dữ liệu trong Tidyverse

So sánh RMSE

# Train model:
train_model_price_3 <- lm(log10_price ~ log10_size + condition,
                          data = train)

# Get predictions and compute RMSE:
get_regression_points(train_model_price_3, newdata = test) %>%
  mutate(sq_residuals = residual^2) %>%
  summarize(rmse = sqrt(mean(sq_residuals)))
# A tibble: 1 x 1
   rmse
  <dbl>
1 0.168
Mô hình hóa với dữ liệu trong Tidyverse

Cùng luyện tập nào!

Mô hình hóa với dữ liệu trong Tidyverse

Preparing Video For Download...