Explaining teaching score with gender

Mô hình hóa với dữ liệu trong Tidyverse

Albert Y. Kim

Assistant Professor of Statistical and Data Sciences

Exploratory data visualization

library(ggplot2)
library(dplyr)
library(moderndive)

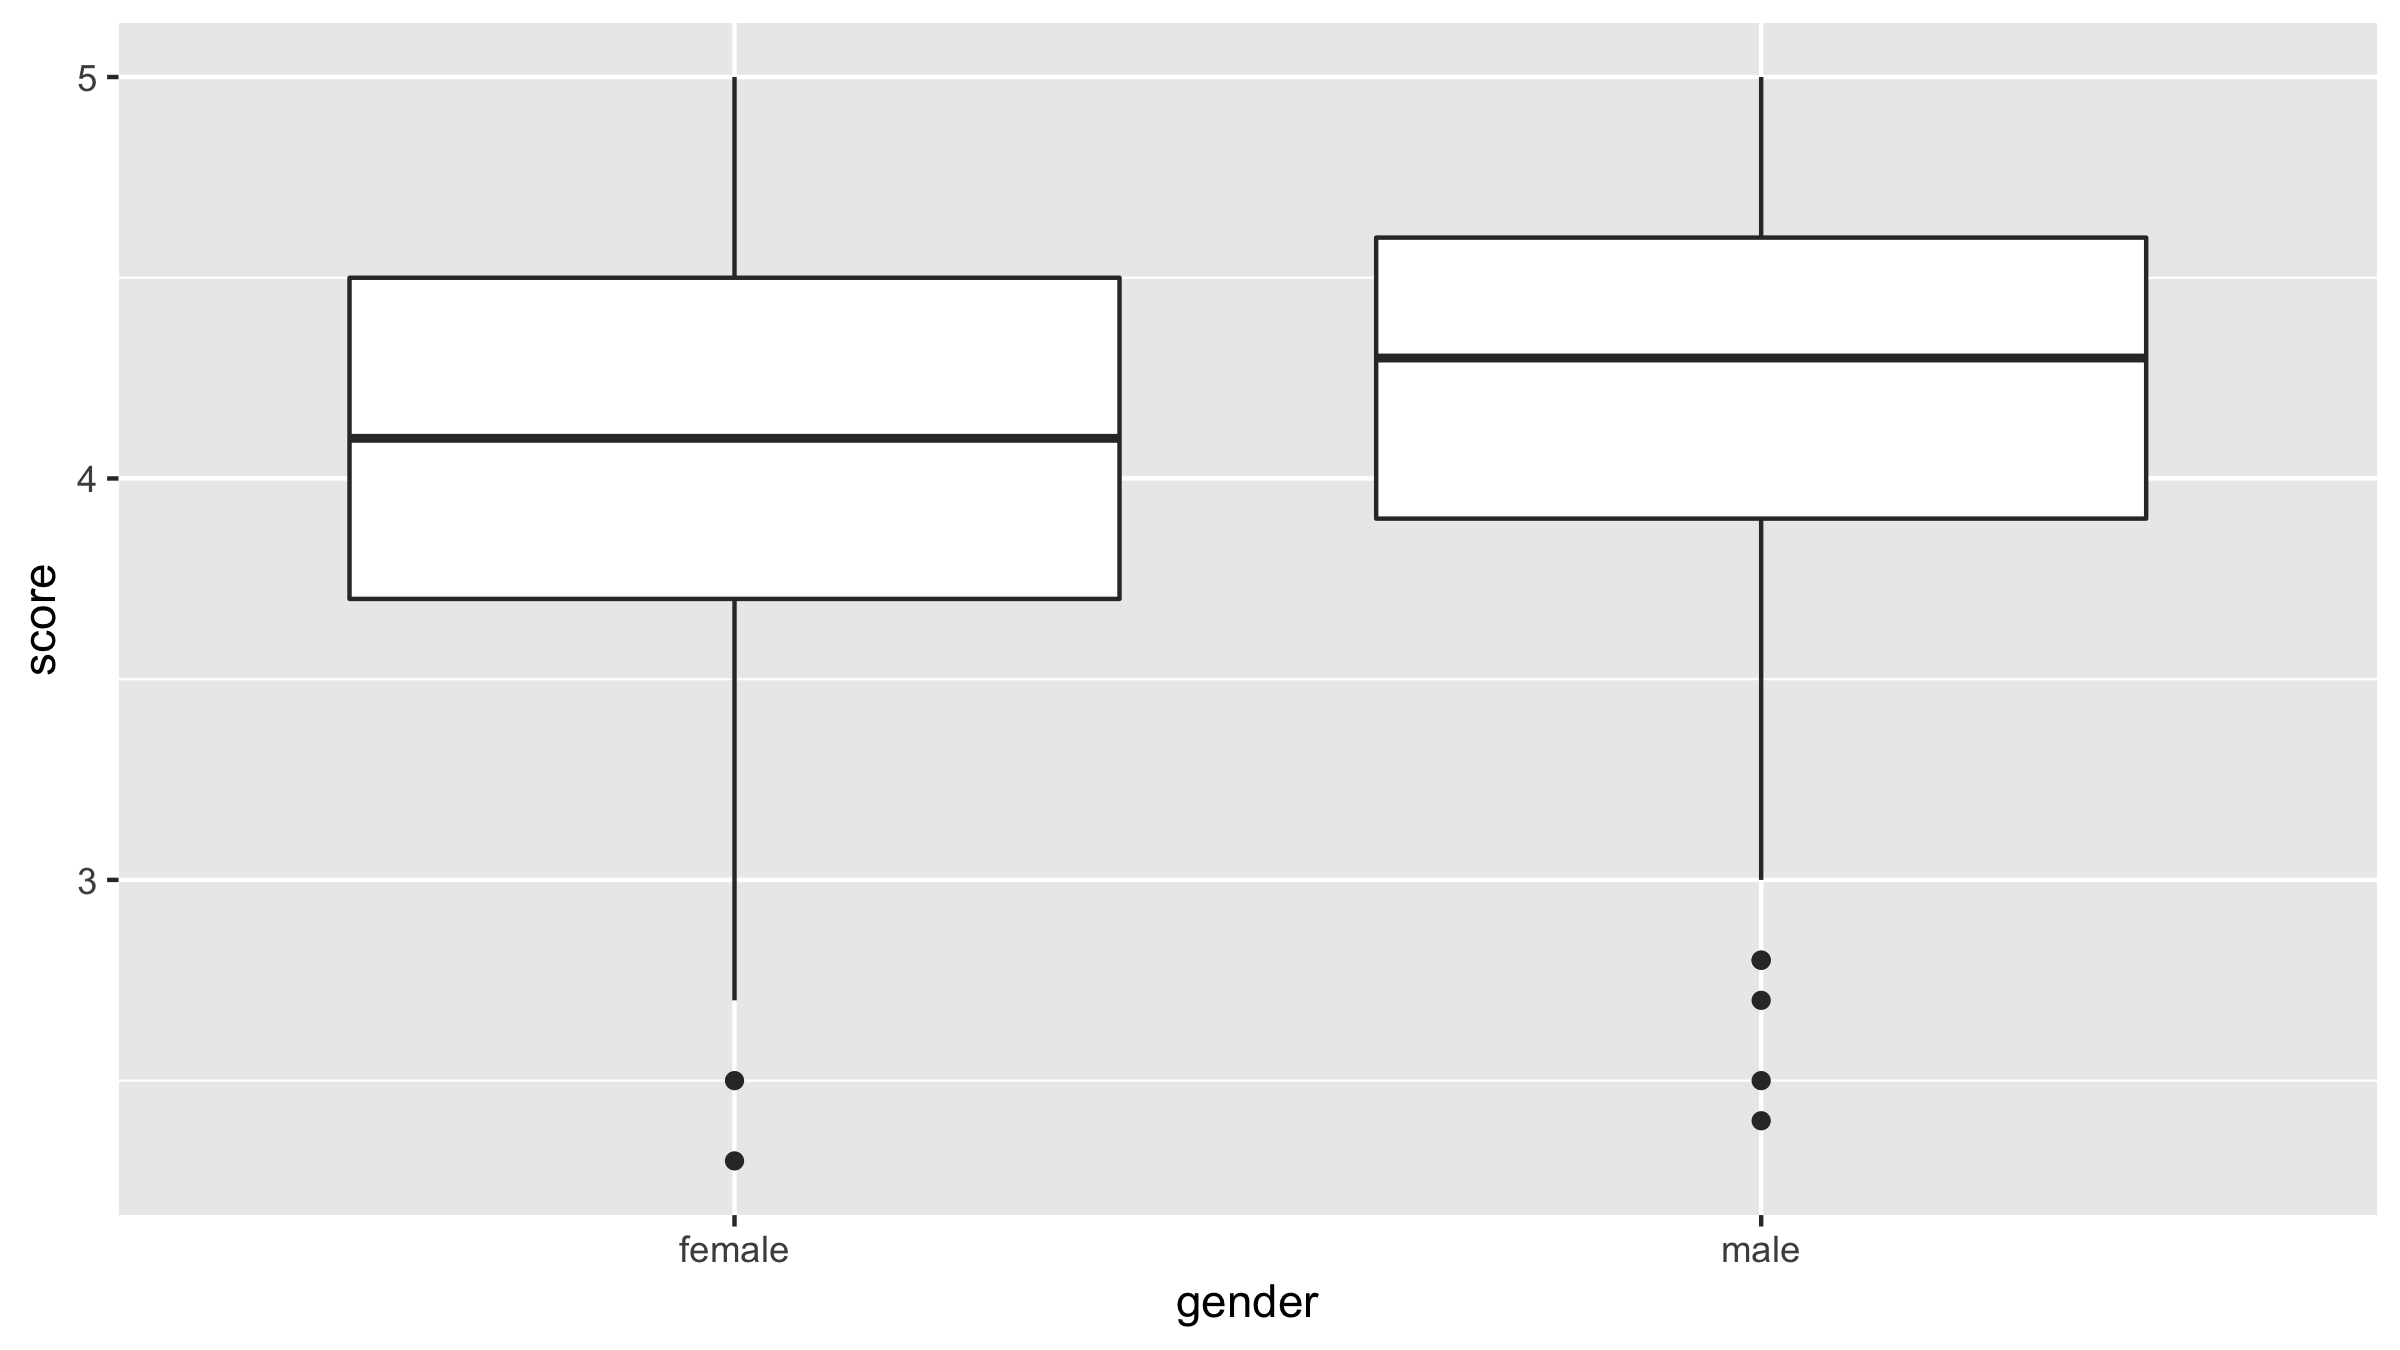
ggplot(evals, aes(x = gender, y = score)) +
  geom_boxplot() +
  labs(x = "gender", y = "score")
Mô hình hóa với dữ liệu trong Tidyverse

Boxplot of score over gender

Mô hình hóa với dữ liệu trong Tidyverse

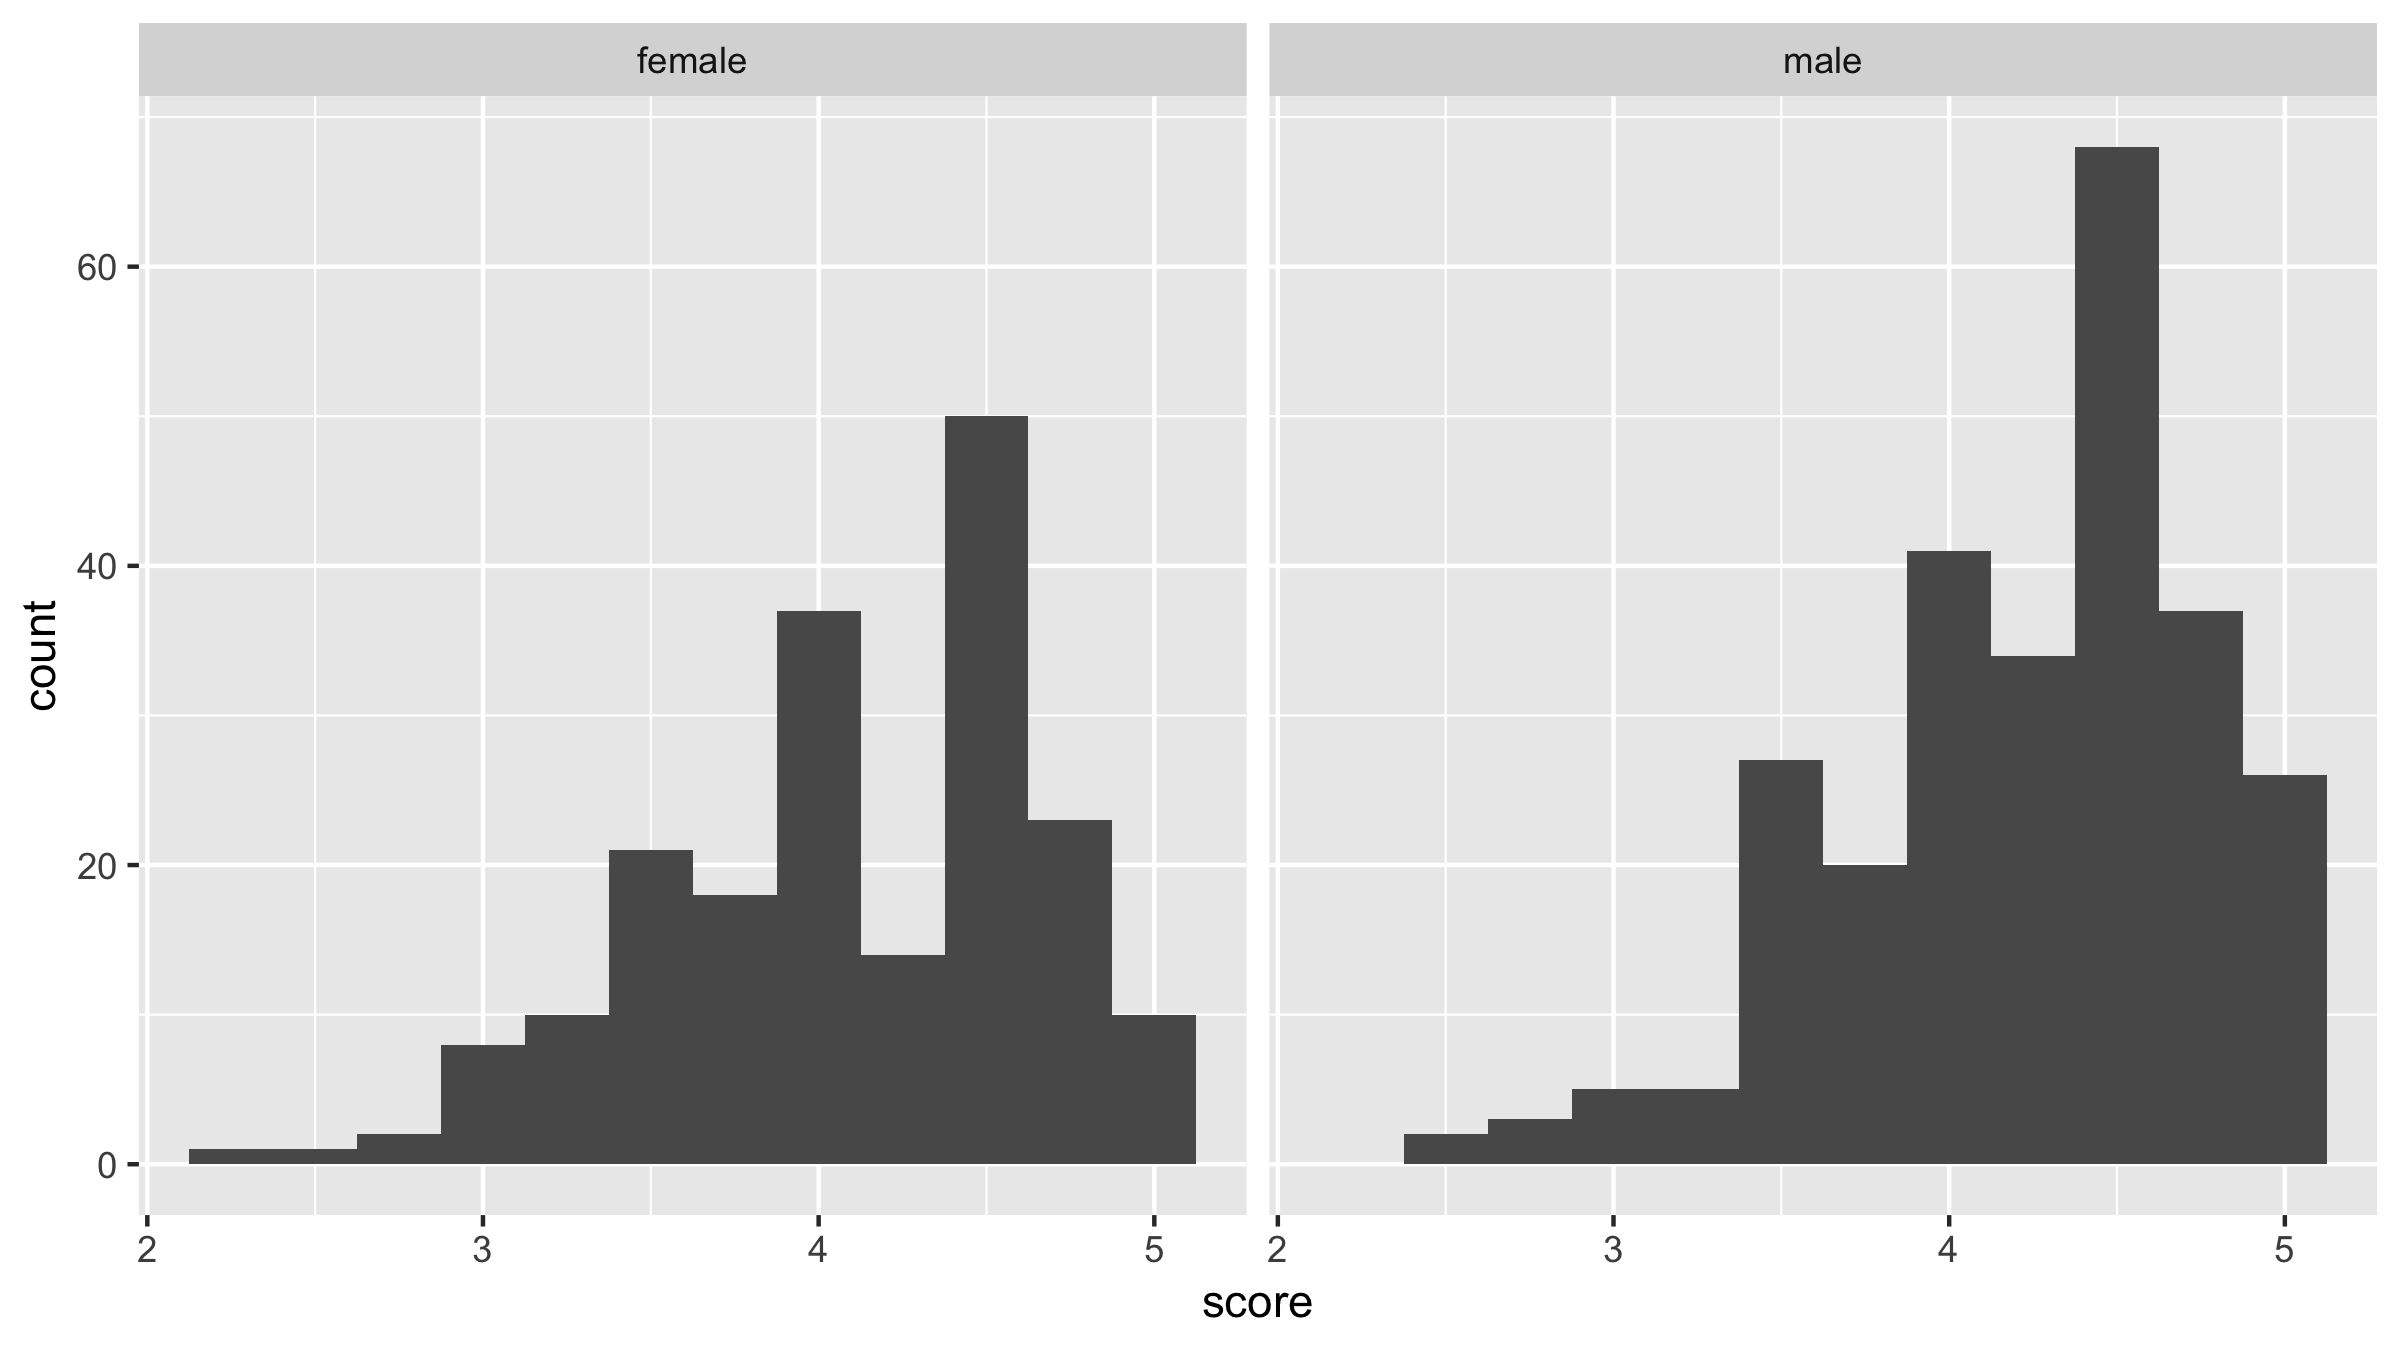
Facetted histogram

library(ggplot2)
library(dplyr)
library(moderndive)

ggplot(evals, aes(x = score)) +
  geom_histogram(binwidth = 0.25) +
  facet_wrap(~gender) +
  labs(x = "gender", y = "score")
Mô hình hóa với dữ liệu trong Tidyverse

Facetted histogram

Mô hình hóa với dữ liệu trong Tidyverse

Fitting a regression model

# Fit regression model
model_score_3 <- lm(score ~ gender, data = evals)

# Get regression table
get_regression_table(model_score_3)
# A tibble: 2 x 7
  term       estimate std_error statistic p_value...
  <chr>         <dbl>     <dbl>     <dbl>   <dbl>...
1 intercept     4.09      0.039    106.     0...
2 gendermale    0.142     0.051      2.78   0.006...
Mô hình hóa với dữ liệu trong Tidyverse

Fitting a regression model

# Compute group means based on gender
evals %>% 
  group_by(gender) %>% 
  summarize(avg_score = mean(score))
# A tibble: 2 x 2
  gender avg_score
  <fct>      <dbl>
1 female      4.09
2 male        4.23
Mô hình hóa với dữ liệu trong Tidyverse

A different categorical explanatory variable: rank

evals %>% 
  group_by(rank) %>% 
  summarize(n = n())
# A tibble: 3 x 2
  rank             n
  <fct>        <int>
1 teaching       102
2 tenure track   108
3 tenured        253
Mô hình hóa với dữ liệu trong Tidyverse

Let's practice!

Mô hình hóa với dữ liệu trong Tidyverse

Preparing Video For Download...