Mô hình hóa với dữ liệu trong Tidyverse
Albert Y. Kim
Assistant Professor of Statistical and Data Sciences
Một bộ dữ liệu giá nhà ở Quận King, bang Washington, gần Seattle (có tại Kaggle.com).
Câu hỏi: Liệu chúng ta có thể dự đoán giá bán nhà dựa trên các đặc trưng?
Biến:
price tính bằng đô la Mỹsqft_living, condition, bedrooms, yr_built, waterfrontTừ gói moderndive cho ModernDive:
library(dplyr)
library(moderndive)
glimpse(house_prices)
Observations: 21,613
Variables: 21
$ id <chr> "7129300520", "6414100192"...
$ date <dttm> 2014-10-13, 2014-12-09, 2015...
$ price <dbl> 221900, 538000, 180000, 604000...
...
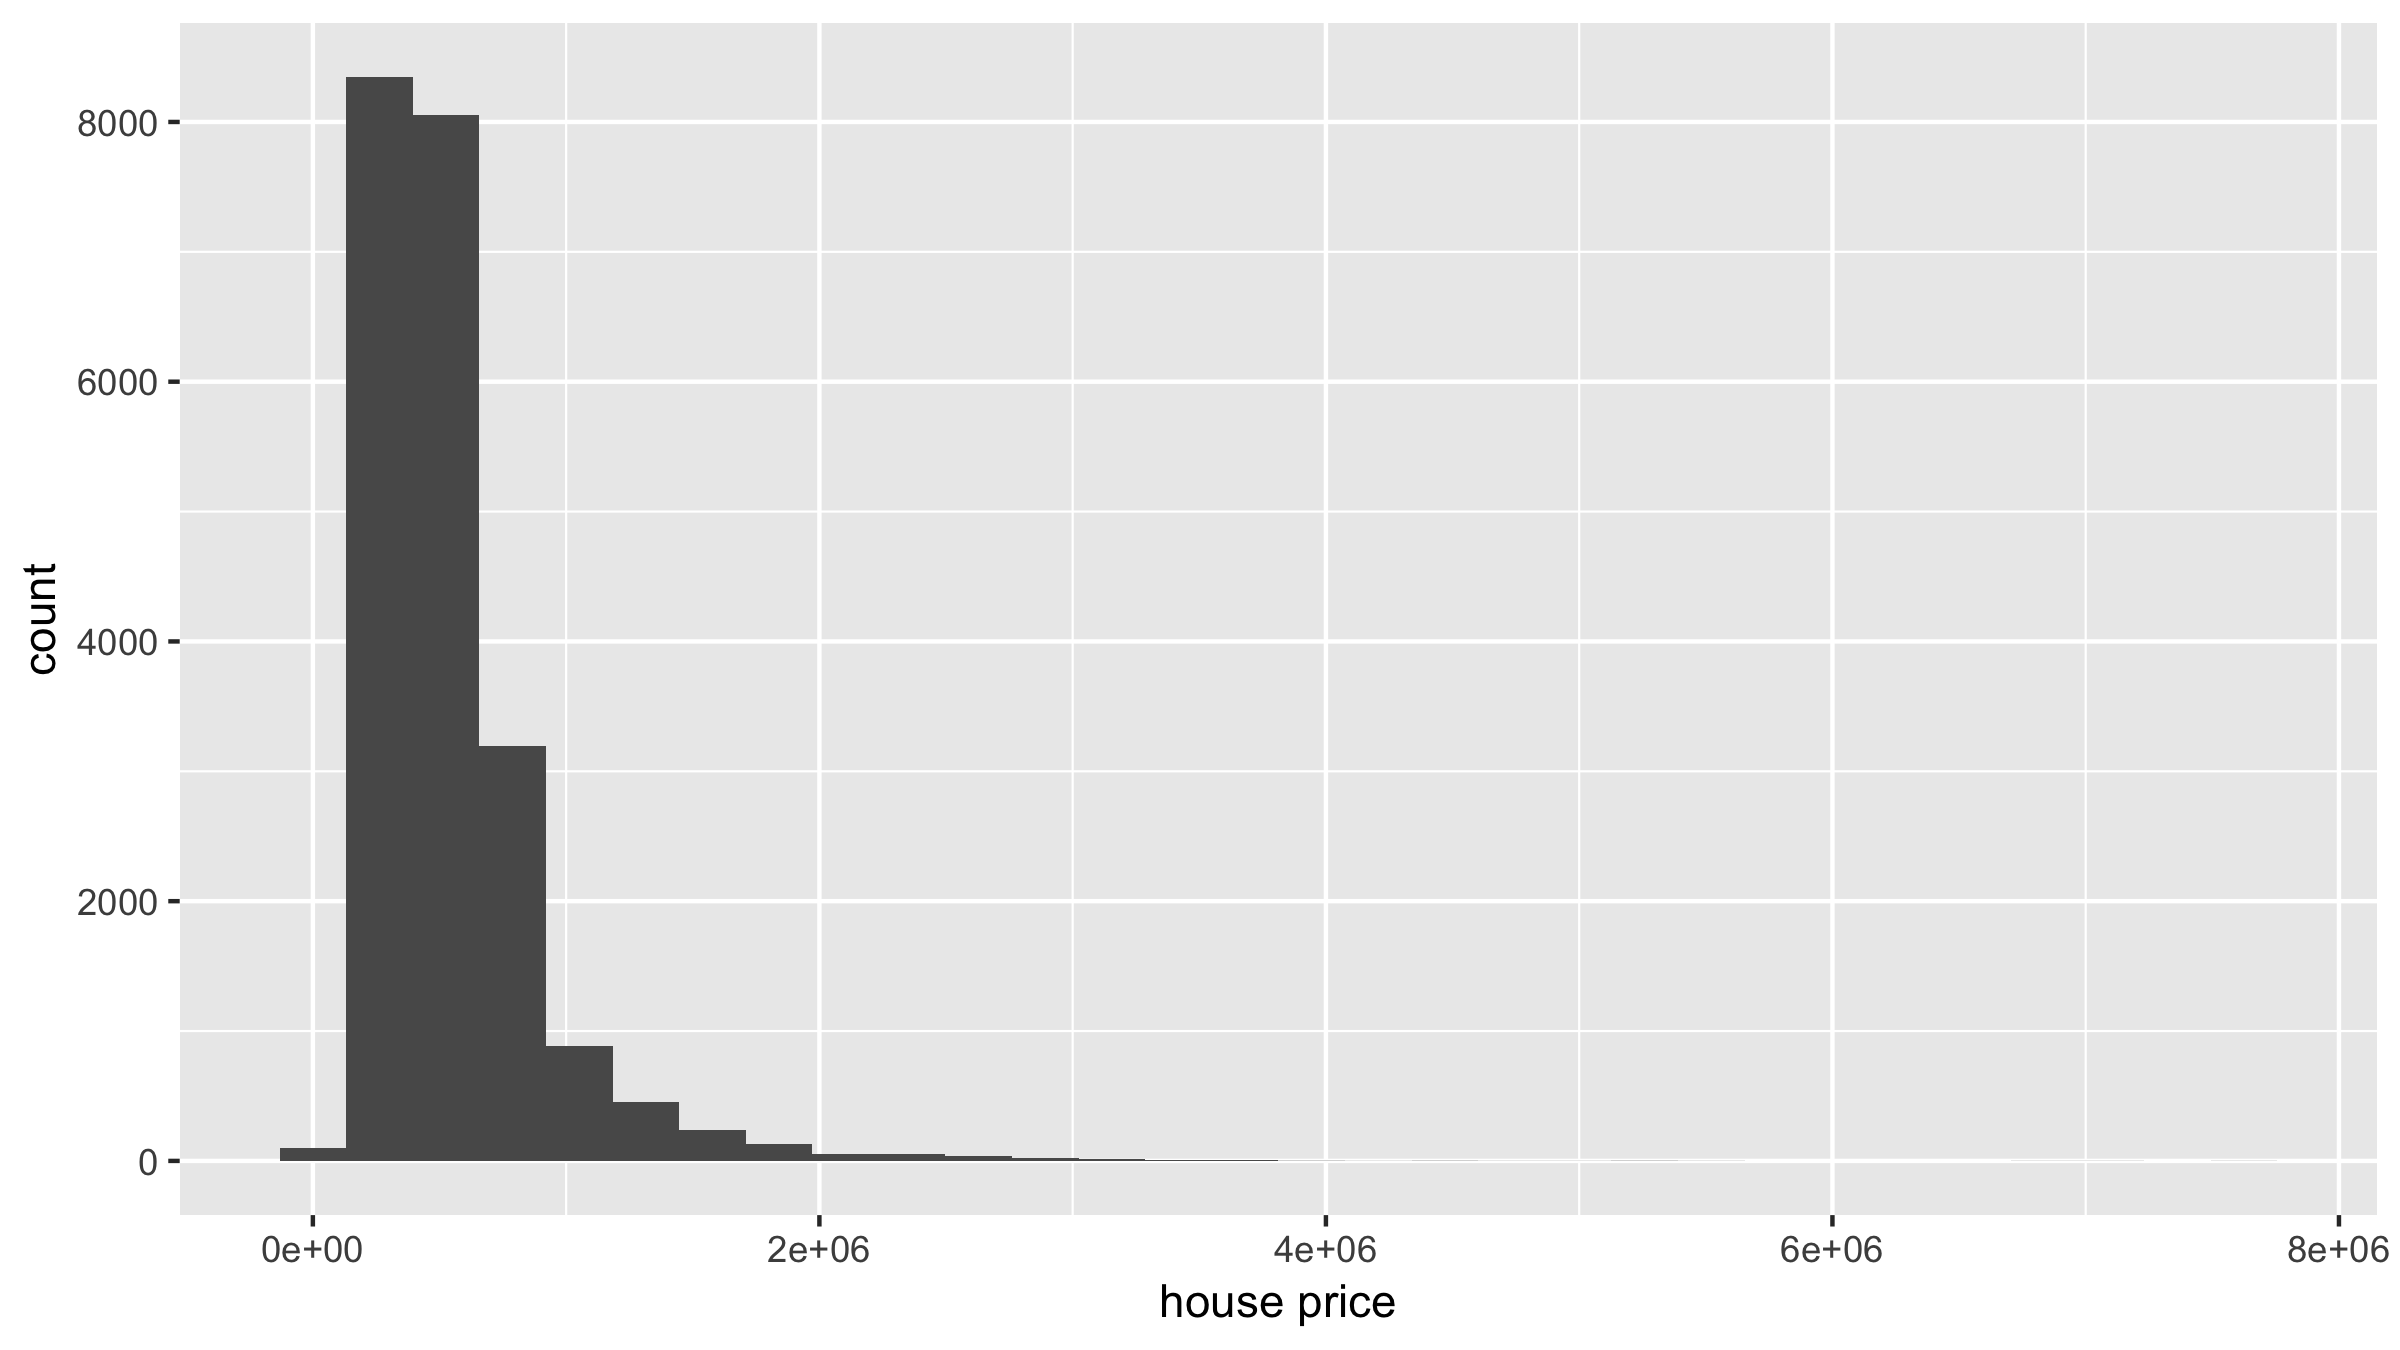
library(ggplot2)
ggplot(house_prices, aes(x = price)) +
geom_histogram() +
labs(x = "house price", y = "count")


# log10() biến đổi giá và diện tích
house_prices <- house_prices %>%
mutate(log10_price = log10(price)) %>%
select(price, log10_price)
# A tibble: 21,613 x 2
price log10_price
<dbl> <dbl>
1 221900 5.35
2 538000 5.73
3 180000 5.26
4 604000 5.78
5 510000 5.71
6 1225000 6.09
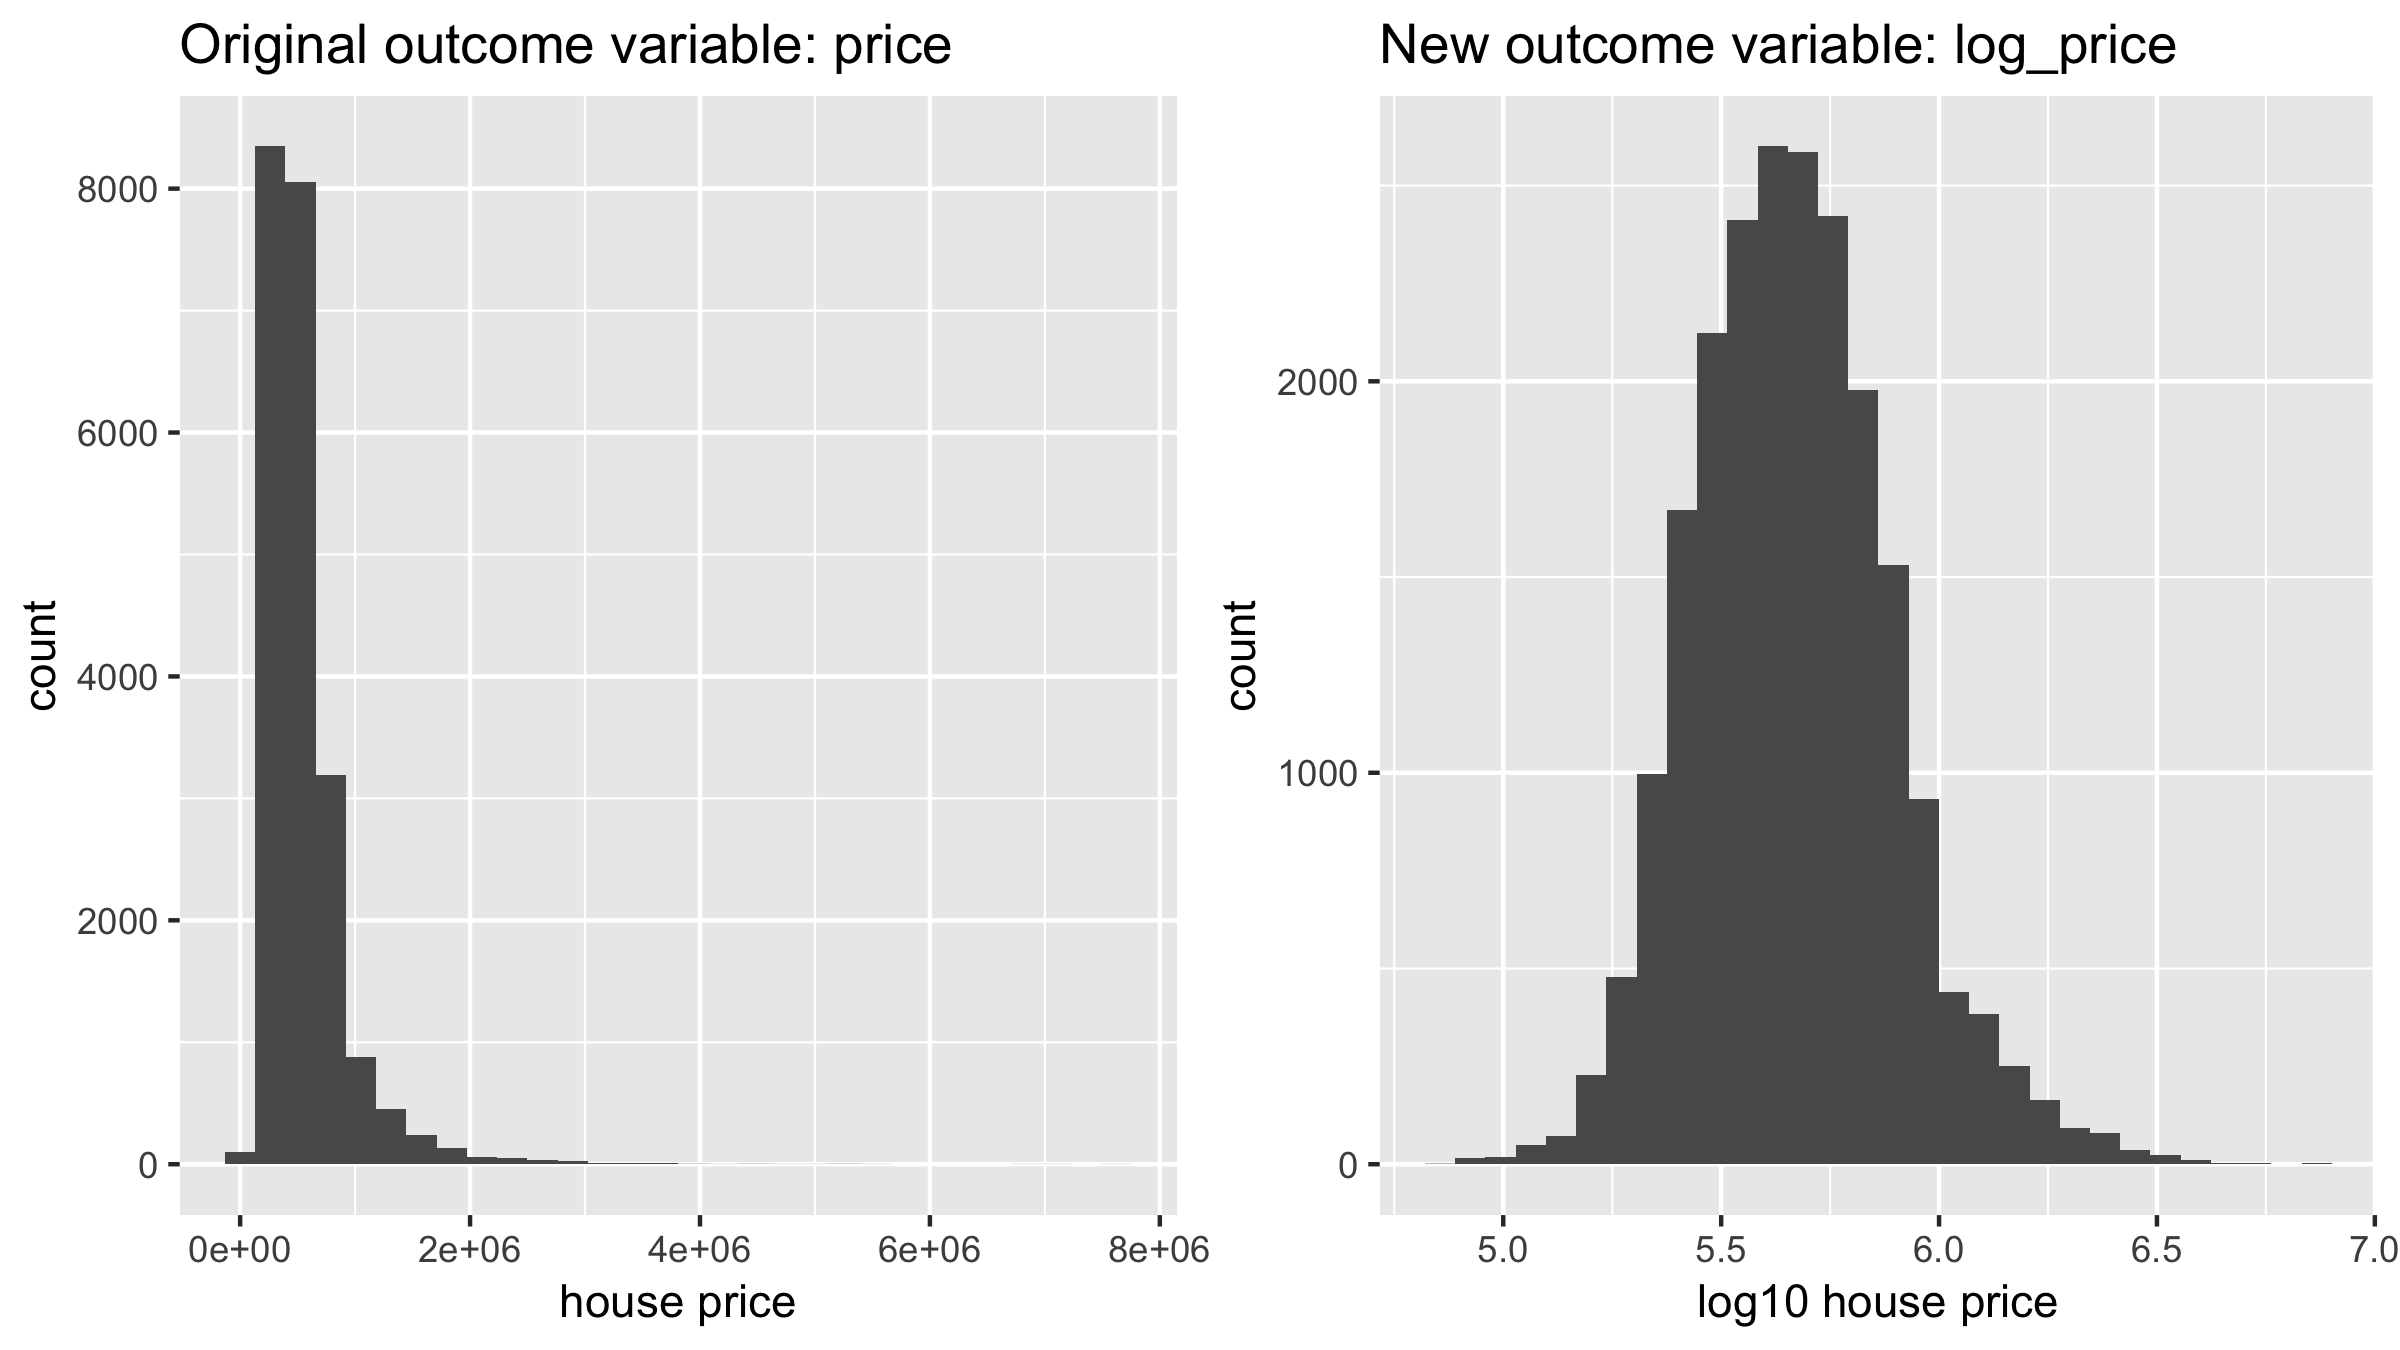
# Biểu đồ tần suất của biến kết quả gốc
ggplot(house_prices, aes(x = price)) +
geom_histogram() +
labs(x = "house price", y = "count")
# Biểu đồ tần suất của biến kết quả mới sau biến đổi log10
ggplot(house_prices, aes(x = log10_price)) +
geom_histogram() +
labs(x = "log10 house price", y = "count")

Mô hình hóa với dữ liệu trong Tidyverse