Predicting teaching score using gender

Mô hình hóa với dữ liệu trong Tidyverse

Albert Y. Kim

Assistant Professor of Statistical and Data Sciences

Group means as predictions

library(ggplot2)
library(dplyr)
library(moderndive)

evals %>%
  group_by(gender) %>%
  summarize(mean_score = mean(score), sd_score = sd(score))
# A tibble: 2 x 3
  gender mean_score sd_score
  <fct>       <dbl>    <dbl>
1 female       4.09    0.564
2 male         4.23    0.522
Mô hình hóa với dữ liệu trong Tidyverse

Computing all predicted values and residuals

# Fit regression model:
model_score_3 <- lm(score ~ gender, data = evals)

# Get information on each point
get_regression_points(model_score_3)
# A tibble: 463 x 5
      ID score gender score_hat residual
   <int> <dbl> <fct>      <dbl>    <dbl>
 1     1   4.7 female      4.09    0.607
 2     2   4.1 female      4.09    0.007
 3     3   3.9 female      4.09   -0.193
 4     4   4.8 female      4.09    0.707
 5     5   4.6 male        4.23    0.366
 6     6   4.3 male        4.23    0.066
Mô hình hóa với dữ liệu trong Tidyverse

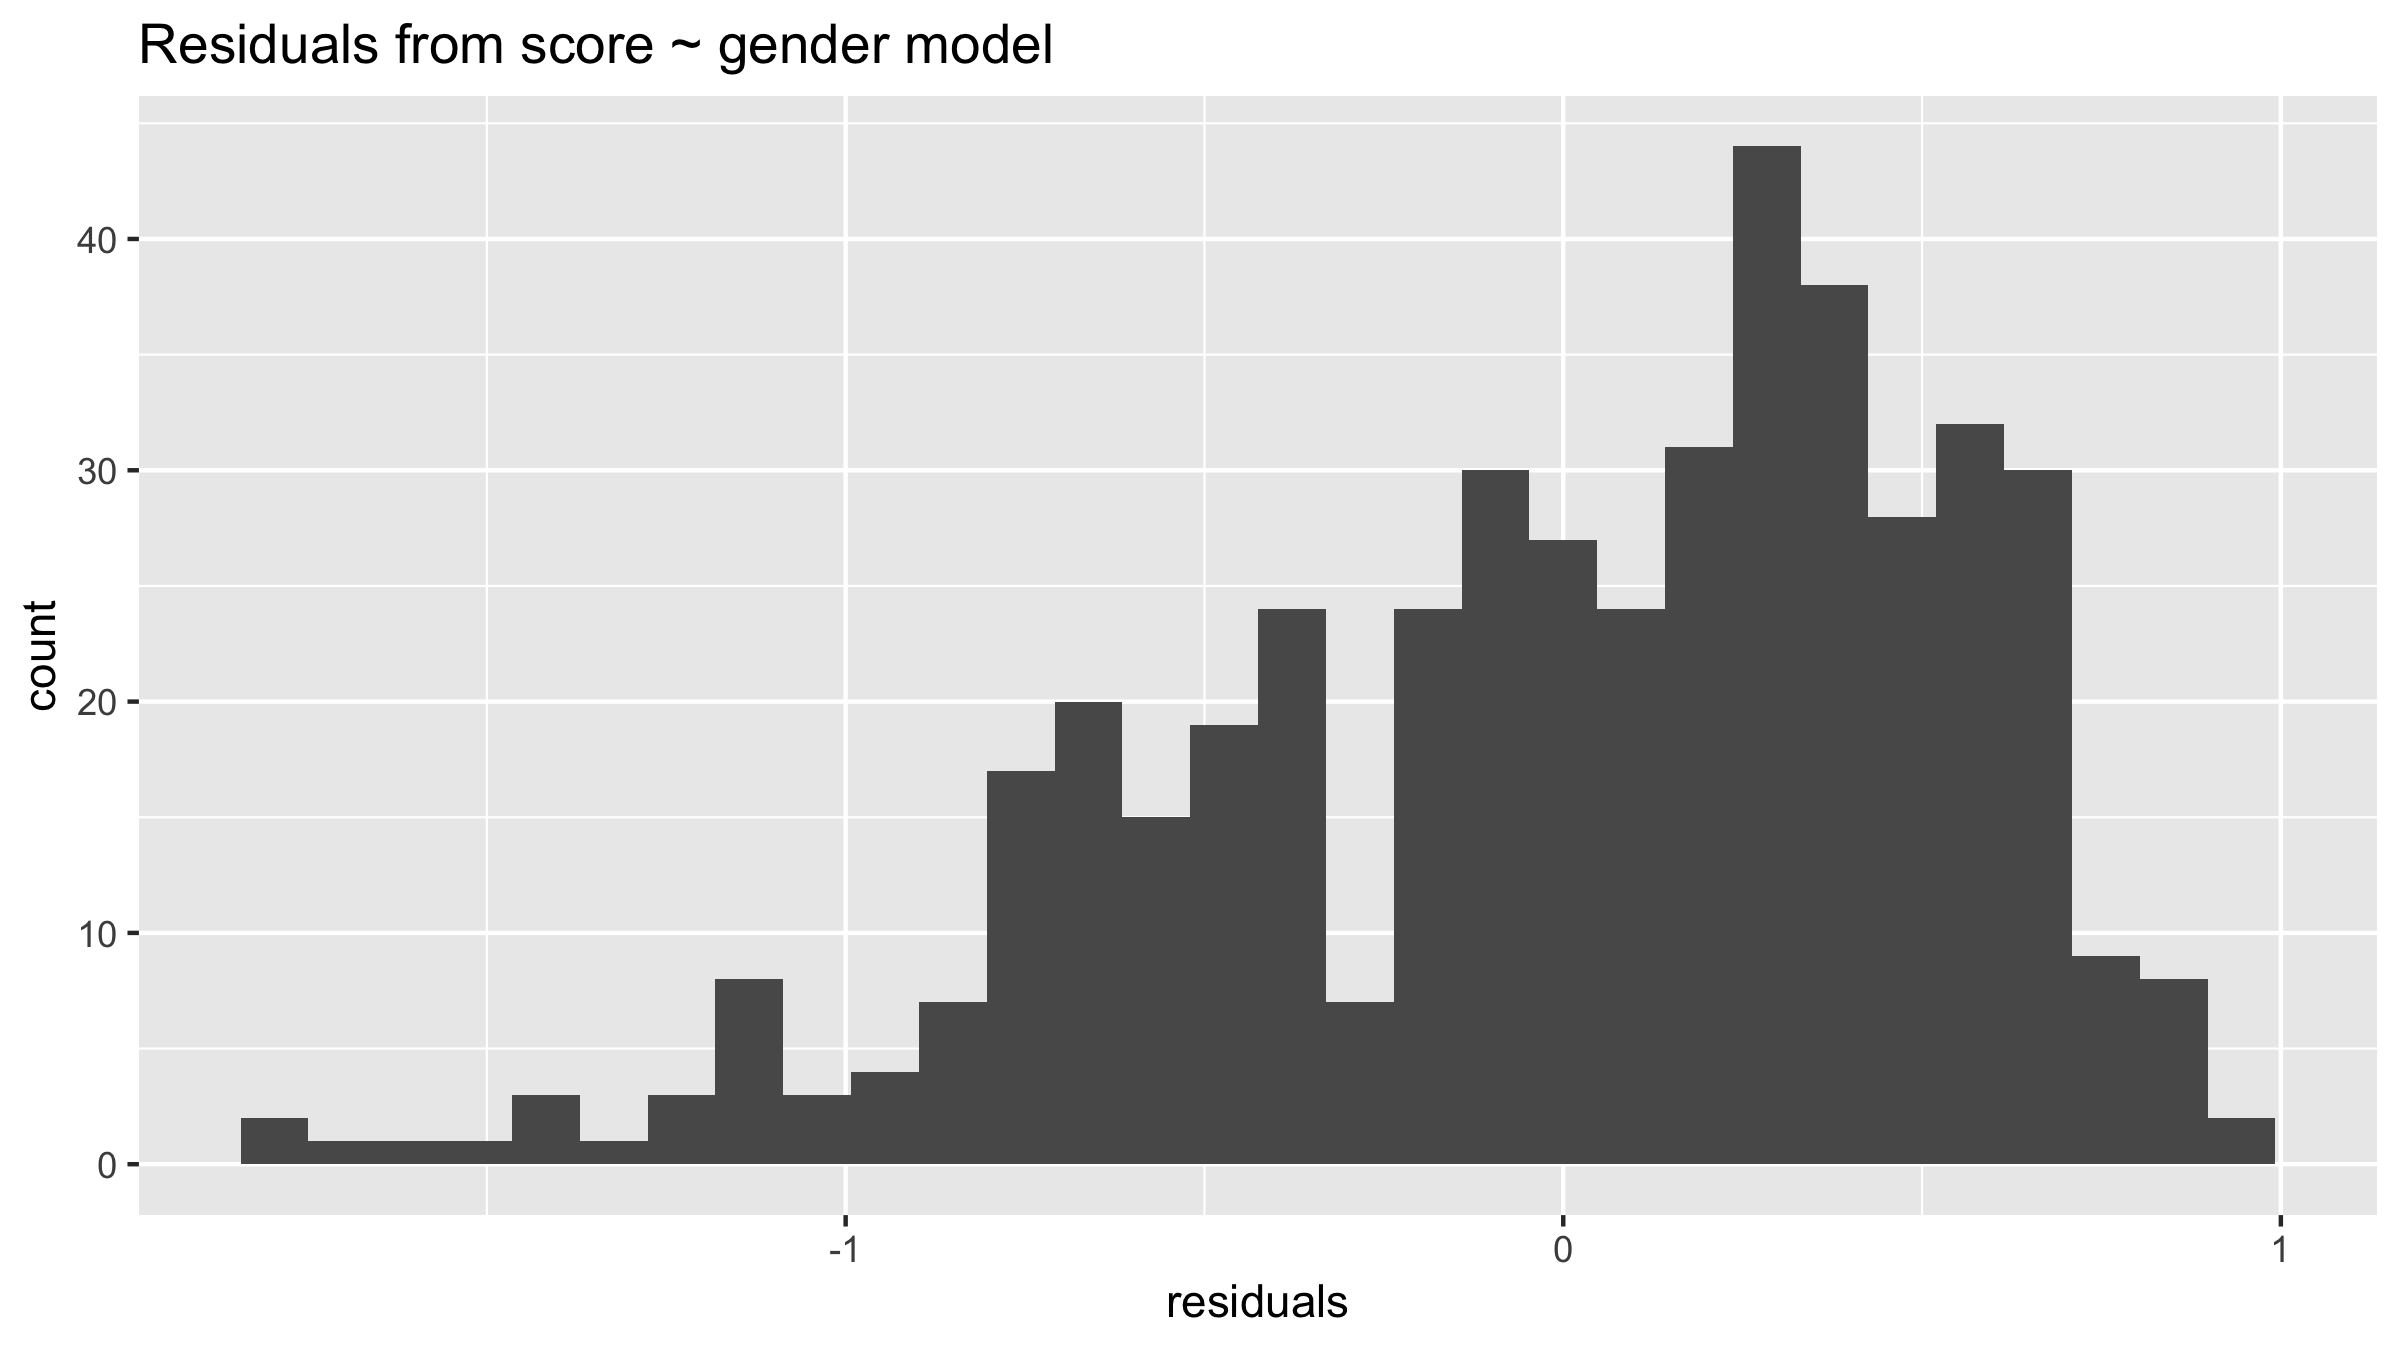
Histogram of residuals

# Fit regression model
model_score_3 <- lm(score ~ gender, data = evals)

# Get regression points
model_score_3_points <- get_regression_points(model_score_3)
model_score_3_points

# Plot residuals ggplot(model_score_3_points, aes(x = residual)) + geom_histogram() + labs(x = "residuals", title = "Residuals from score ~ gender model")
Mô hình hóa với dữ liệu trong Tidyverse

Histogram of residuals

Mô hình hóa với dữ liệu trong Tidyverse

Let's practice!

Mô hình hóa với dữ liệu trong Tidyverse

Preparing Video For Download...