The modeling problem for explanation

Mô hình hóa với dữ liệu trong Tidyverse

Albert Y. Kim

Assistant Professor of Statistical and Data Sciences

Recall: General modeling framework formula

$$ y = f(\vec{x}) + \epsilon $$

Where:

  • $y$: outcome variable of interest
  • $\vec{x}$: explanatory/predictor variables
  • $f()$: function of the relationship between $y$ and $\vec{x}$ AKA the signal
  • $\epsilon$: unsystematic error component AKA the noise
Mô hình hóa với dữ liệu trong Tidyverse

The modeling problem

Consider $y = f(\vec{x}) + \epsilon$.

  1. $f()$ and $\epsilon$ are unknown
  2. $n$ observations of $y$ and $\vec{x}$ are known/given in the data
  3. Goal: Fit a model $\hat{f}()$ that approximates $f()$ while ignoring $\epsilon$
  4. Goal restated: Separate the signal from the noise
  5. Can then generate fitted/predicted values $\hat{y} = \hat{f}(\vec{x})$
Mô hình hóa với dữ liệu trong Tidyverse

Modeling for explanation example

Mô hình hóa với dữ liệu trong Tidyverse

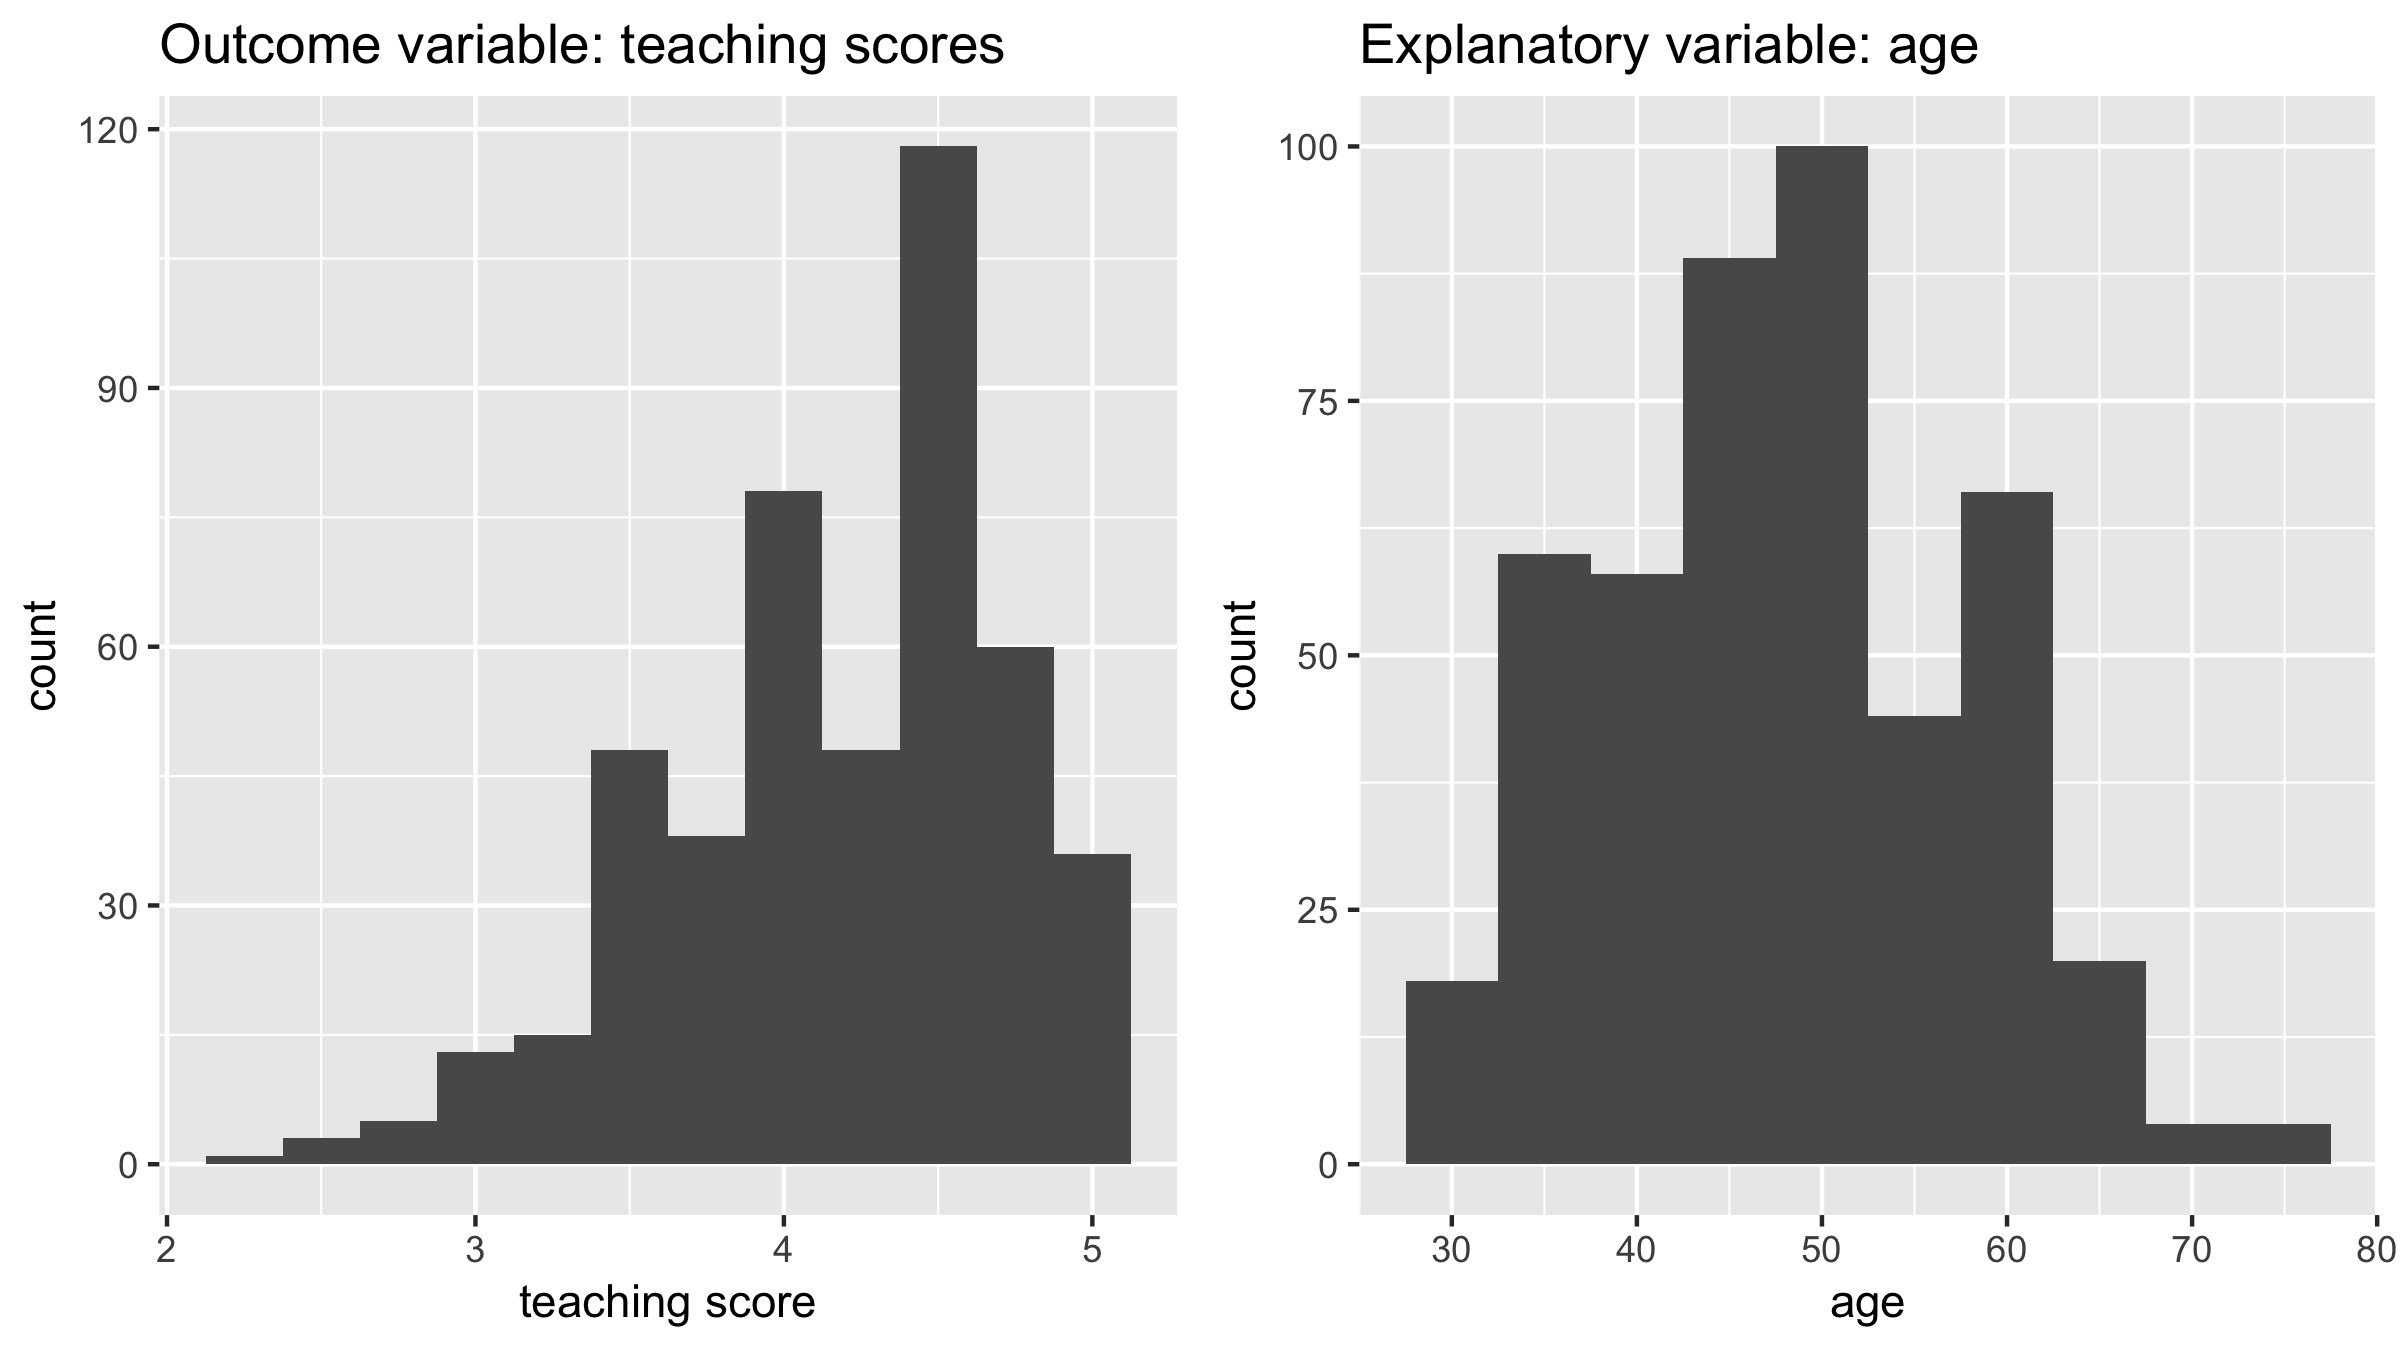
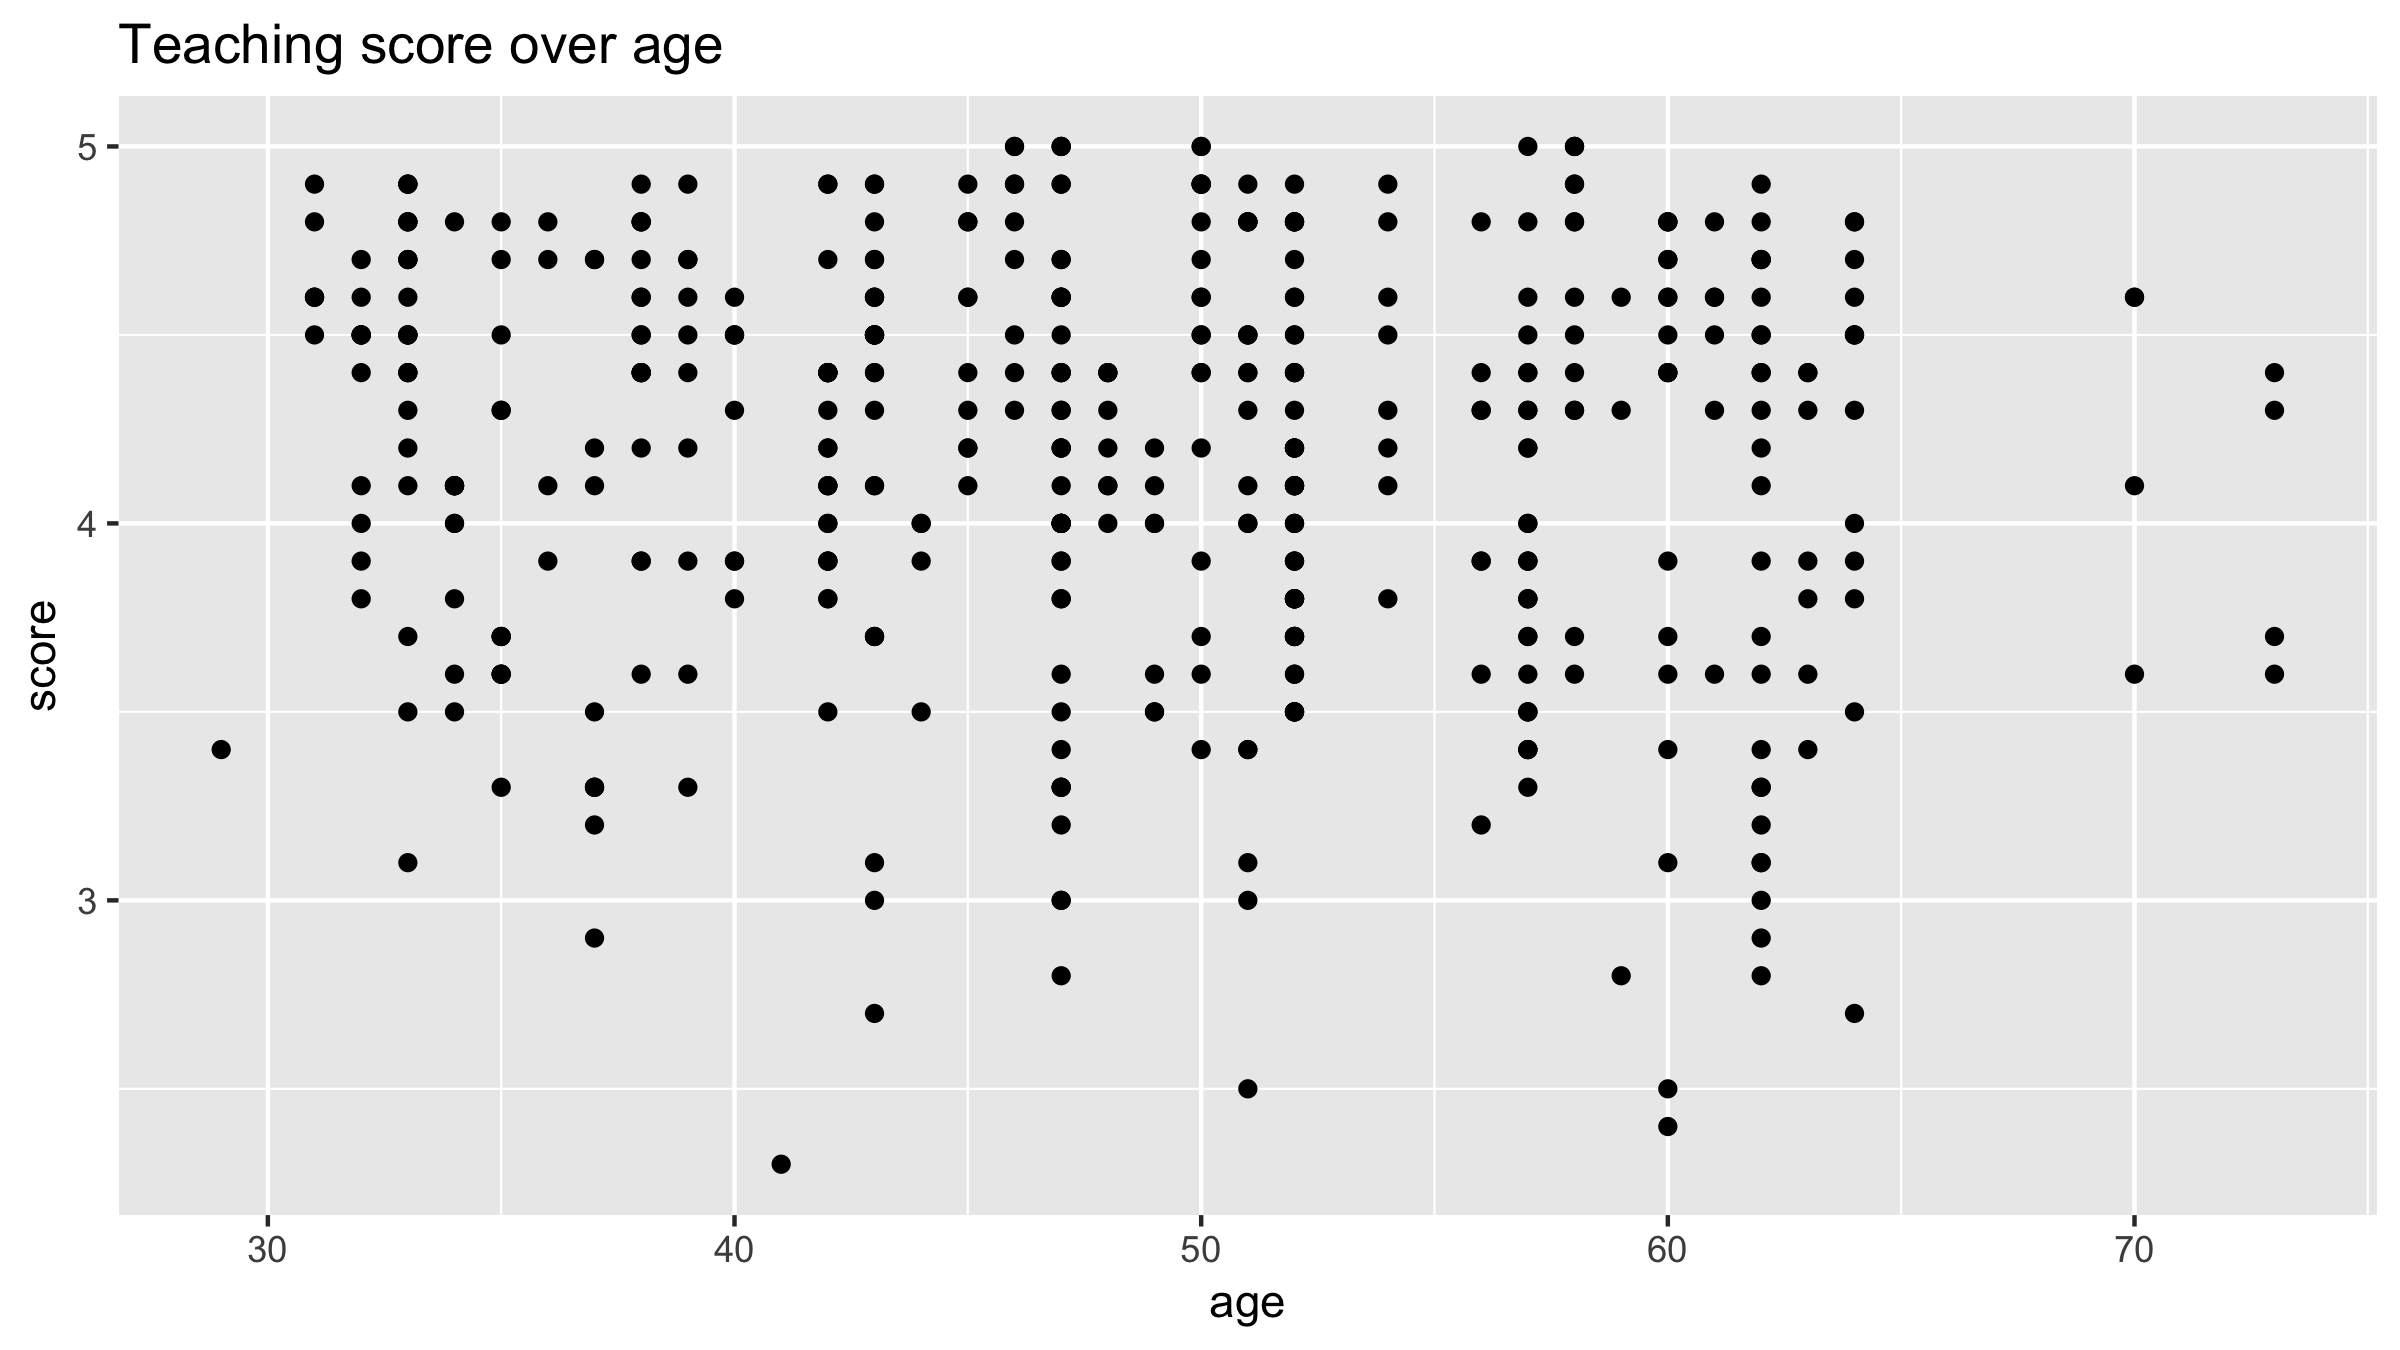
EDA of relationship

library(ggplot2)
library(dplyr)
library(moderndive)

ggplot(evals, aes(x = age, y = score)) +
  geom_point() + 
  labs(x = "age", y = "score",
       title = "Teaching score over age")
Mô hình hóa với dữ liệu trong Tidyverse

EDA of relationship

Mô hình hóa với dữ liệu trong Tidyverse

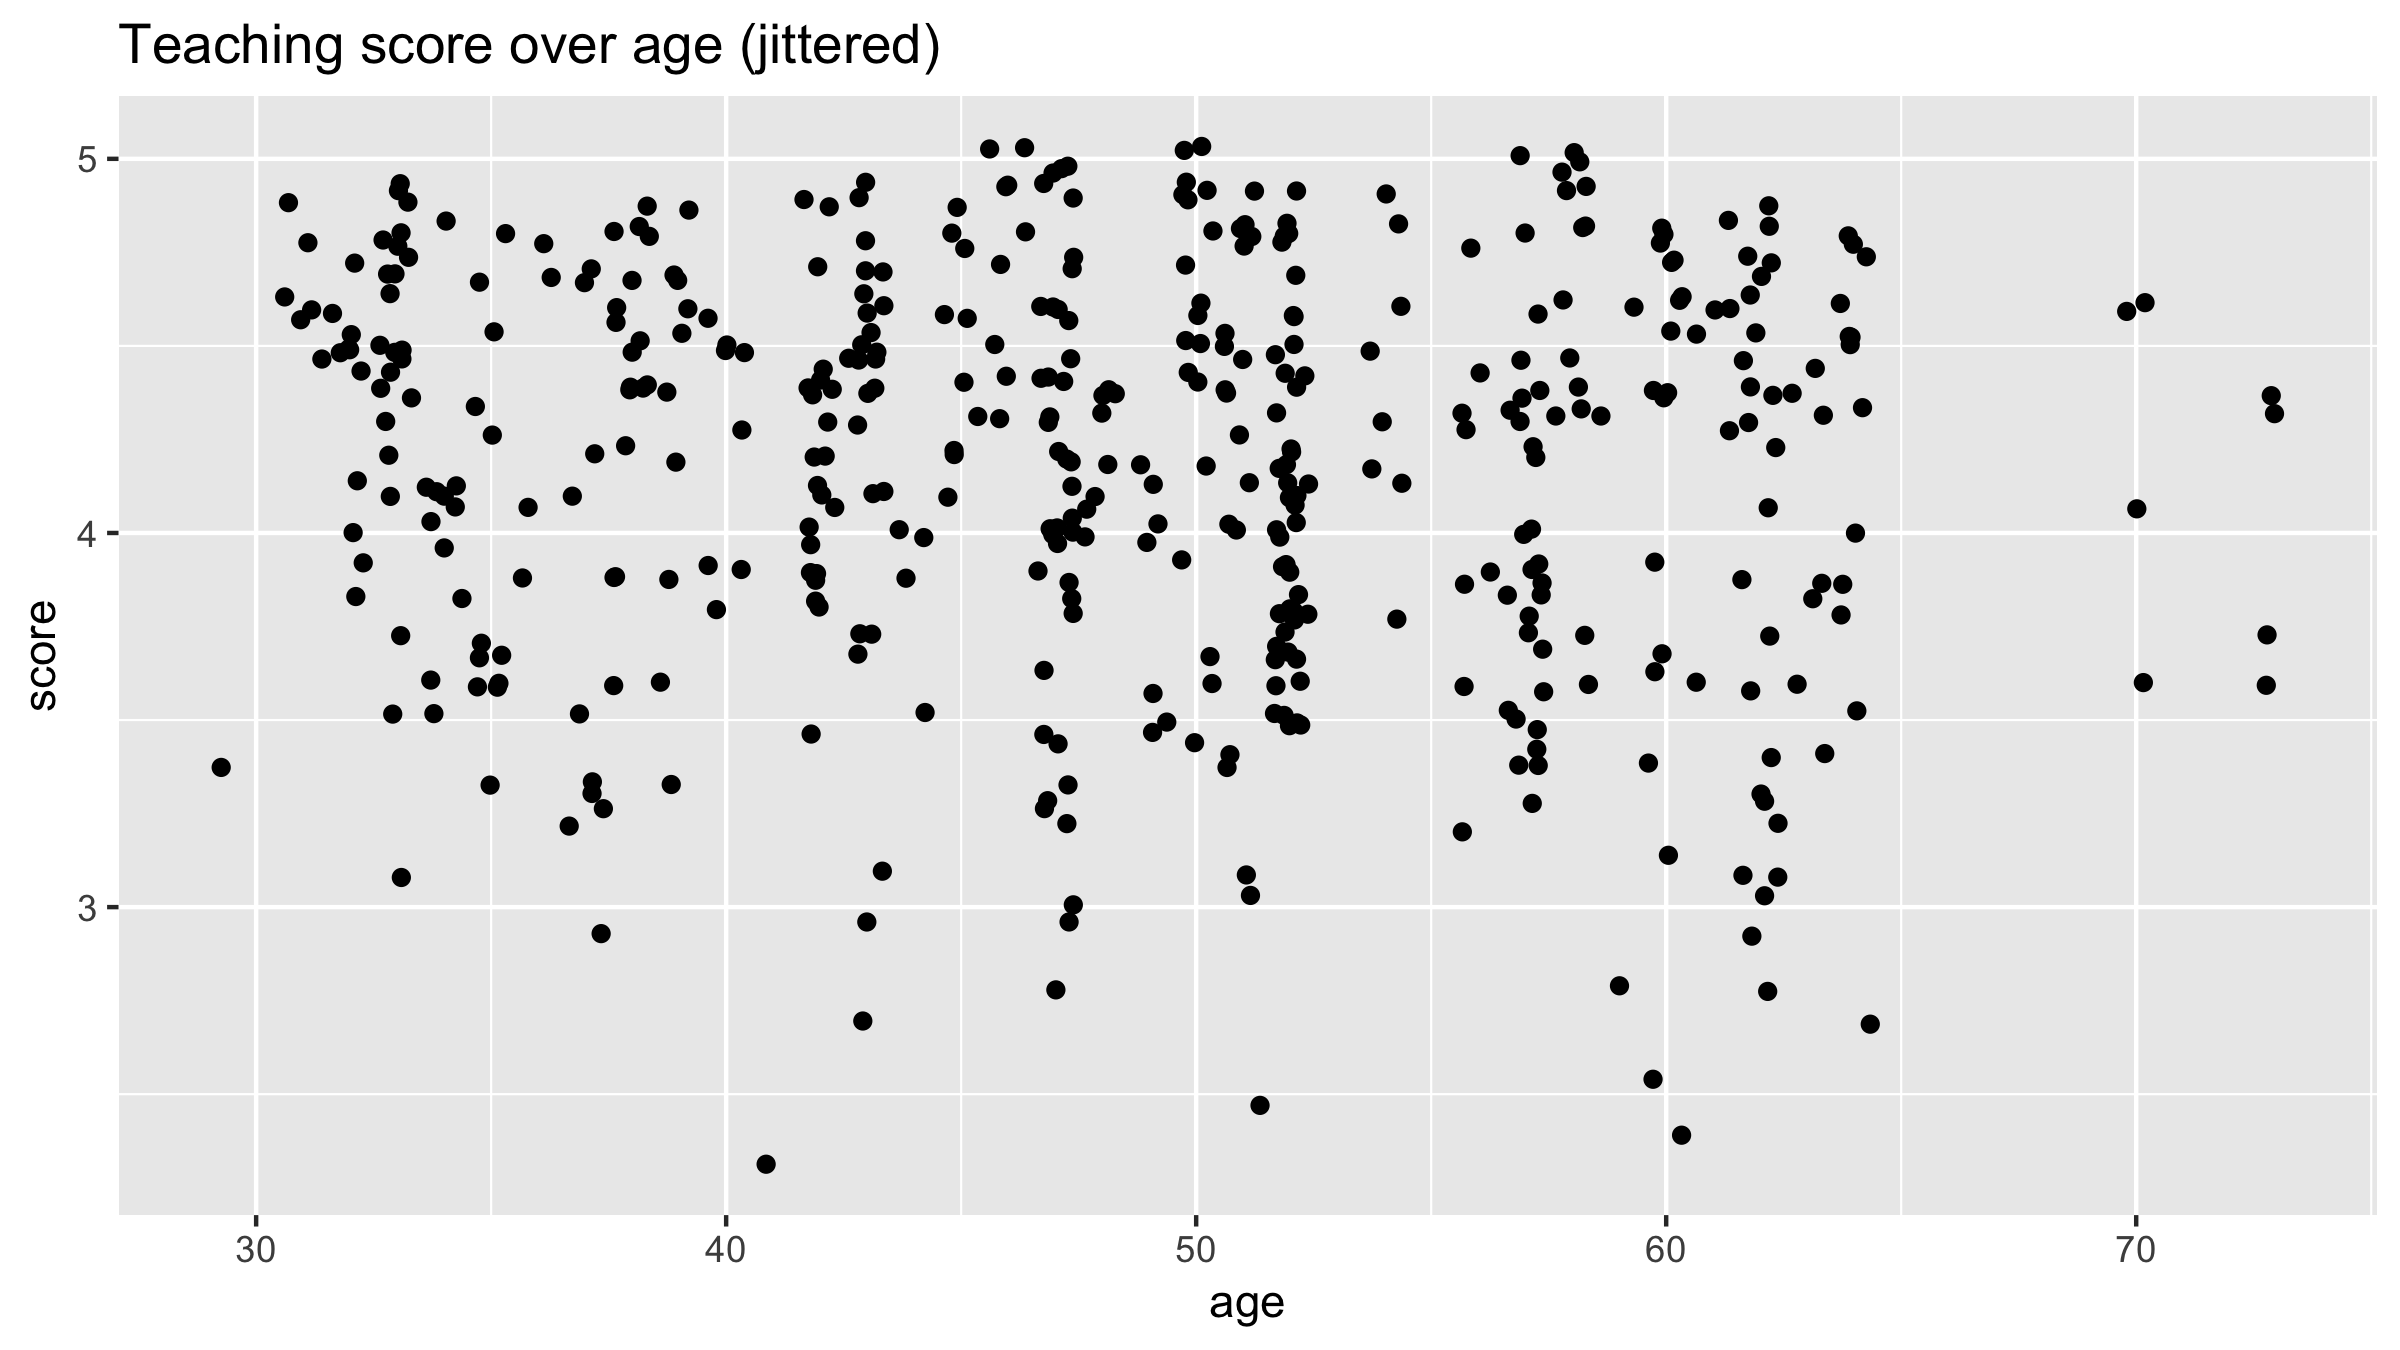
Jittered scatterplot

library(ggplot2)
library(dplyr)
library(moderndive)

# Use geom_jitter() instead of geom_point()
ggplot(evals, aes(x = age, y = score)) +
  geom_jitter() + 
  labs(x = "age", y = "score",
       title = "Teaching score over age (jittered)")
Mô hình hóa với dữ liệu trong Tidyverse

Jittered scatterplot

Mô hình hóa với dữ liệu trong Tidyverse

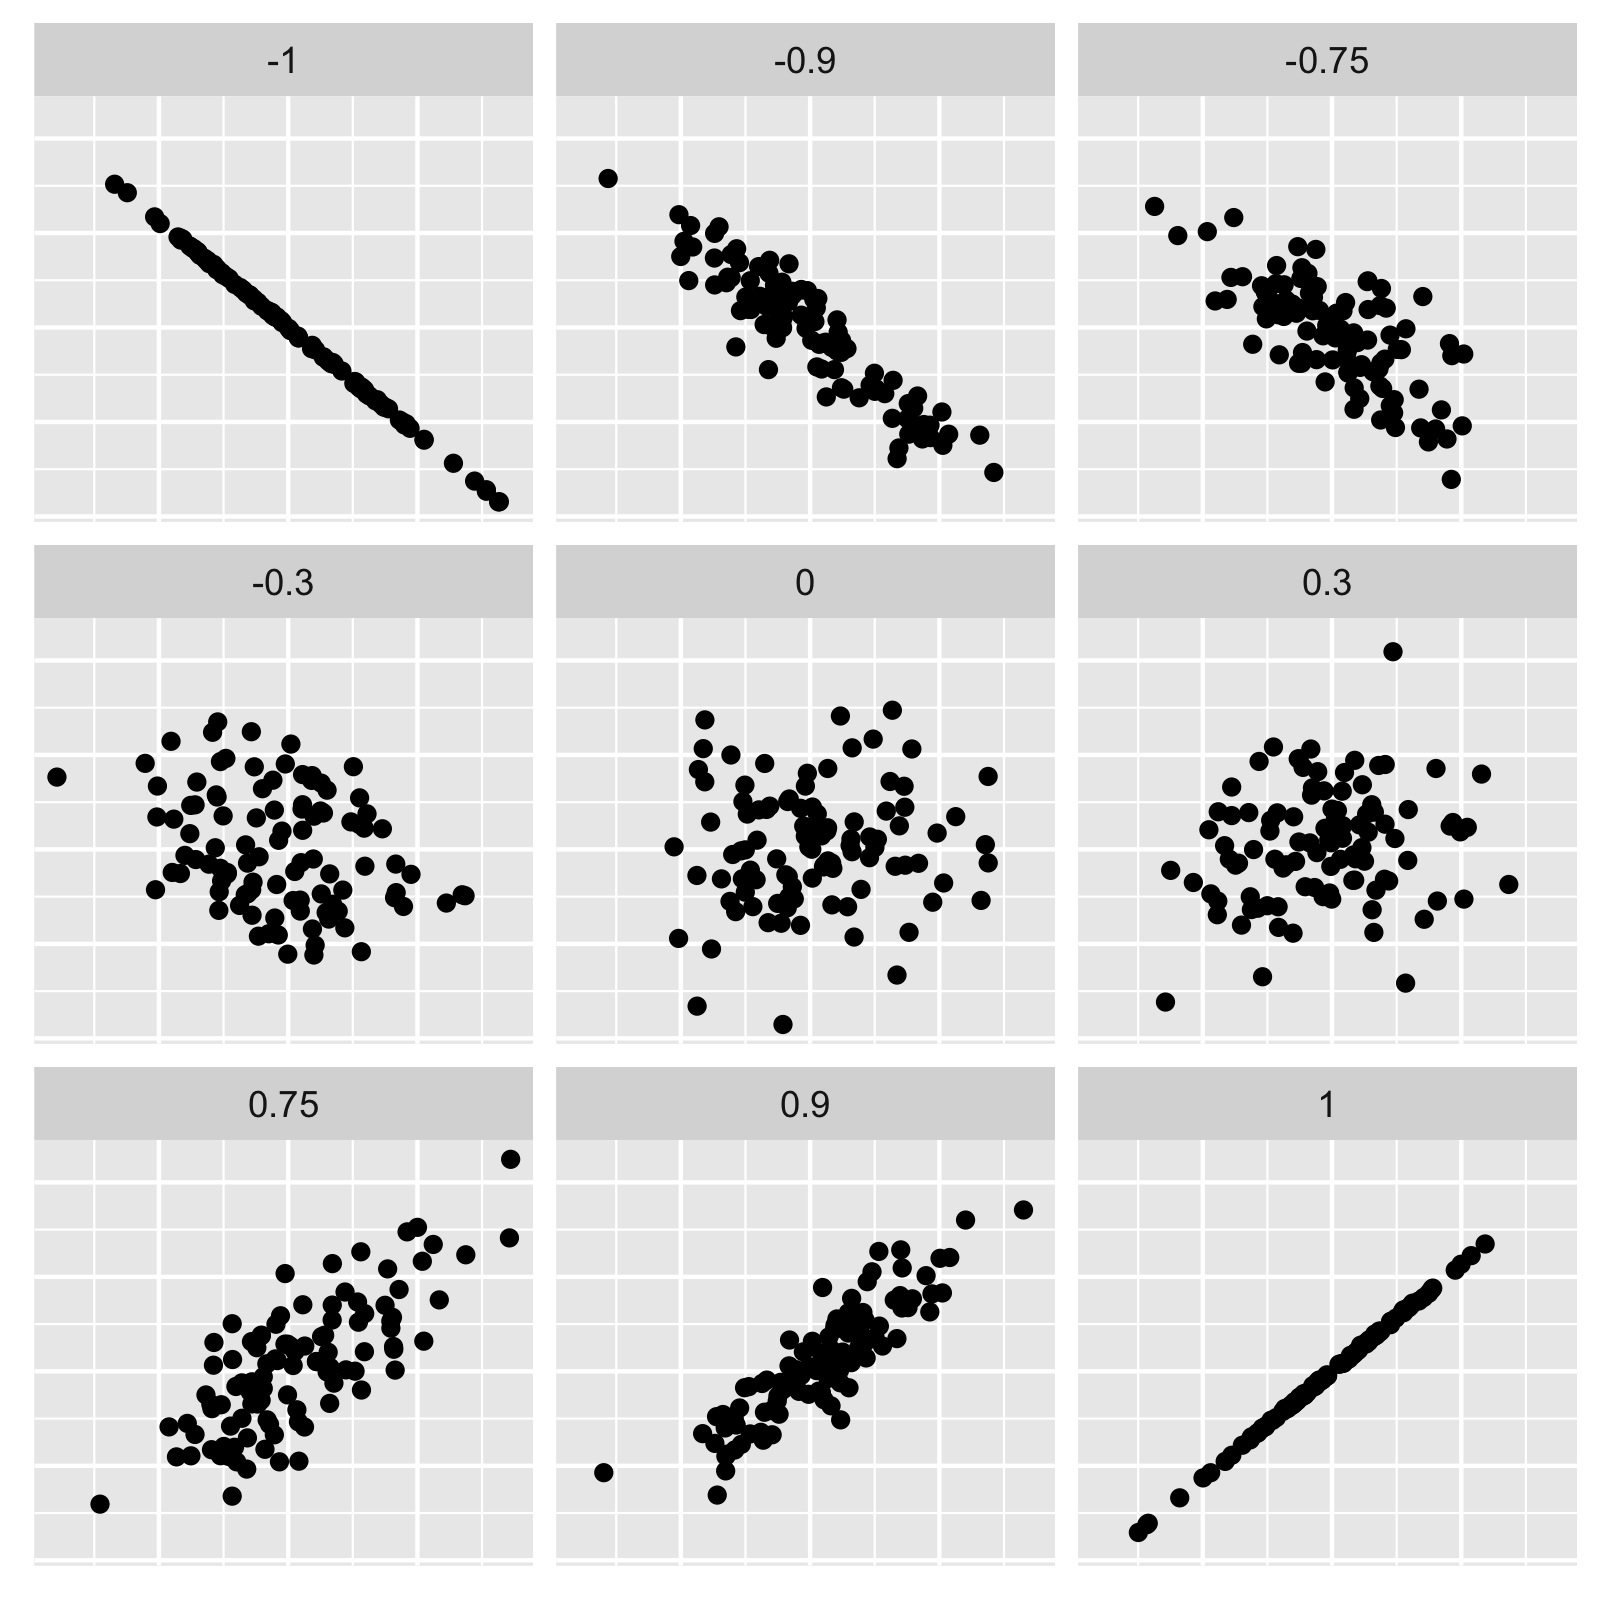
Correlation coefficient

Mô hình hóa với dữ liệu trong Tidyverse

Computing the correlation coefficient

evals %>% 
  summarize(correlation = cor(score, age))
# A tibble: 1 x 1
  correlation
        <dbl>
1      -0.107
Mô hình hóa với dữ liệu trong Tidyverse

Let's practice!

Mô hình hóa với dữ liệu trong Tidyverse

Preparing Video For Download...