Find relationships between multiple time series

Trực quan hóa dữ liệu chuỗi thời gian trong Python

Thomas Vincent

Head of Data Science, Getty Images

Correlations between two variables

  • In the field of Statistics, the correlation coefficient is a measure used to determine the strength or lack of relationship between two variables:
    • Pearson's coefficient can be used to compute the correlation coefficient between variables for which the relationship is thought to be linear
    • Kendall Tau or Spearman rank can be used to compute the correlation coefficient between variables for which the relationship is thought to be non-linear
Trực quan hóa dữ liệu chuỗi thời gian trong Python

Compute correlations

from scipy.stats.stats import pearsonr
from scipy.stats.stats import spearmanr
from scipy.stats.stats import kendalltau
x = [1, 2, 4, 7]
y = [1, 3, 4, 8]
pearsonr(x, y)
SpearmanrResult(correlation=0.9843, pvalue=0.01569)
spearmanr(x, y)
SpearmanrResult(correlation=1.0, pvalue=0.0)
kendalltau(x, y)
KendalltauResult(correlation=1.0, pvalue=0.0415)
Trực quan hóa dữ liệu chuỗi thời gian trong Python

What is a correlation matrix?

  • When computing the correlation coefficient between more than two variables, you obtain a correlation matrix
    • Range: [-1, 1]
    • 0: no relationship
    • 1: strong positive relationship
    • -1: strong negative relationship
Trực quan hóa dữ liệu chuỗi thời gian trong Python

What is a correlation matrix?

  • A correlation matrix is always "symmetric"
  • The diagonal values will always be equal to 1
   x     y     z
x  1.00 -0.46  0.49
y -0.46  1.00 -0.61
z  0.49 -0.61  1.00
Trực quan hóa dữ liệu chuỗi thời gian trong Python

Computing Correlation Matrices with Pandas

corr_p = meat[['beef', 'veal','turkey']].corr(method='pearson')
print(corr_p)
          beef     veal     turkey
beef      1.000   -0.829    0.738
veal     -0.829    1.000   -0.768
turkey    0.738   -0.768    1.000
corr_s = meat[['beef', 'veal','turkey']].corr(method='spearman')
print(corr_s)
          beef     veal     turkey
beef      1.000   -0.812    0.778
veal     -0.812    1.000   -0.829
turkey    0.778   -0.829    1.000
Trực quan hóa dữ liệu chuỗi thời gian trong Python

Computing Correlation Matrices with Pandas

corr_mat = meat.corr(method='pearson')
Trực quan hóa dữ liệu chuỗi thời gian trong Python

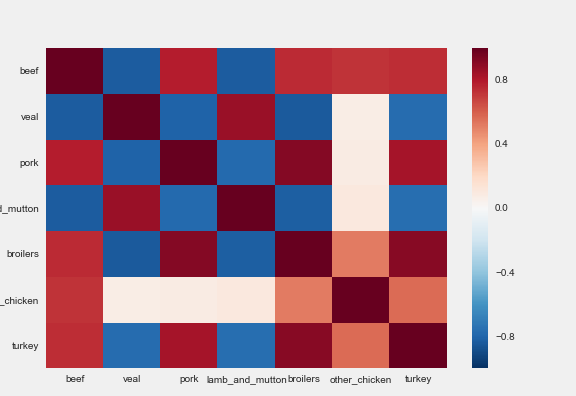
Heatmap

import seaborn as sns

sns.heatmap(corr_mat)
Trực quan hóa dữ liệu chuỗi thời gian trong Python

Heatmap

A heatmap of the correlation matrix

Trực quan hóa dữ liệu chuỗi thời gian trong Python

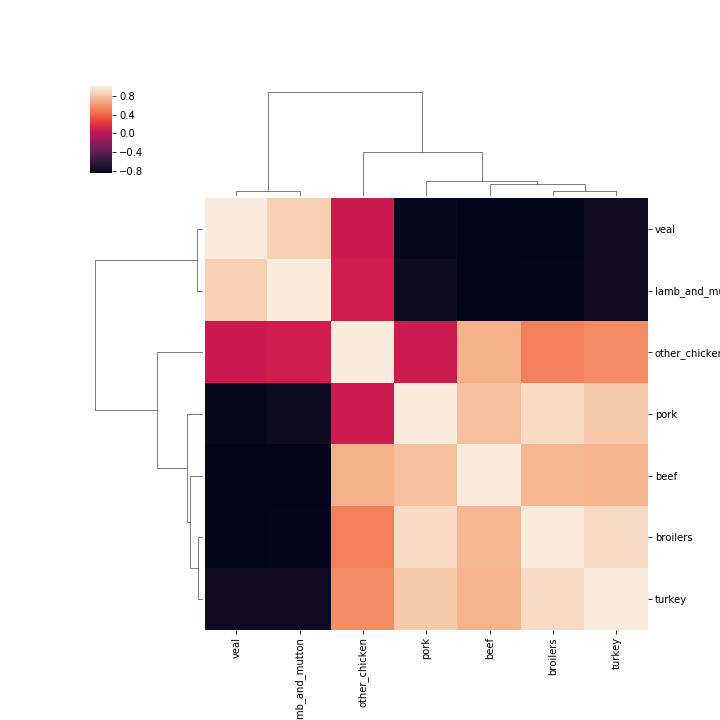
Clustermap

sns.clustermap(corr_mat)
Trực quan hóa dữ liệu chuỗi thời gian trong Python

A clustermap of the correlation matrix

Trực quan hóa dữ liệu chuỗi thời gian trong Python

Let's practice!

Trực quan hóa dữ liệu chuỗi thời gian trong Python

Preparing Video For Download...