Compute correlations between time series

Trực quan hóa dữ liệu chuỗi thời gian trong Python

Thomas Vincent

Head of Data Science, Getty Images

Trends in Jobs data

print(trend_df)
datestamp  Agriculture  Business services  Construction

2000-01-01          NaN                NaN           NaN   
2000-02-01          NaN                NaN           NaN   
2000-03-01          NaN                NaN           NaN   
2000-04-01          NaN                NaN           NaN   
2000-05-01          NaN                NaN           NaN   
2000-06-01          NaN                NaN           NaN   
2000-07-01     9.170833           4.787500      6.329167   
2000-08-01     9.466667           4.820833      6.304167   
...
Trực quan hóa dữ liệu chuỗi thời gian trong Python

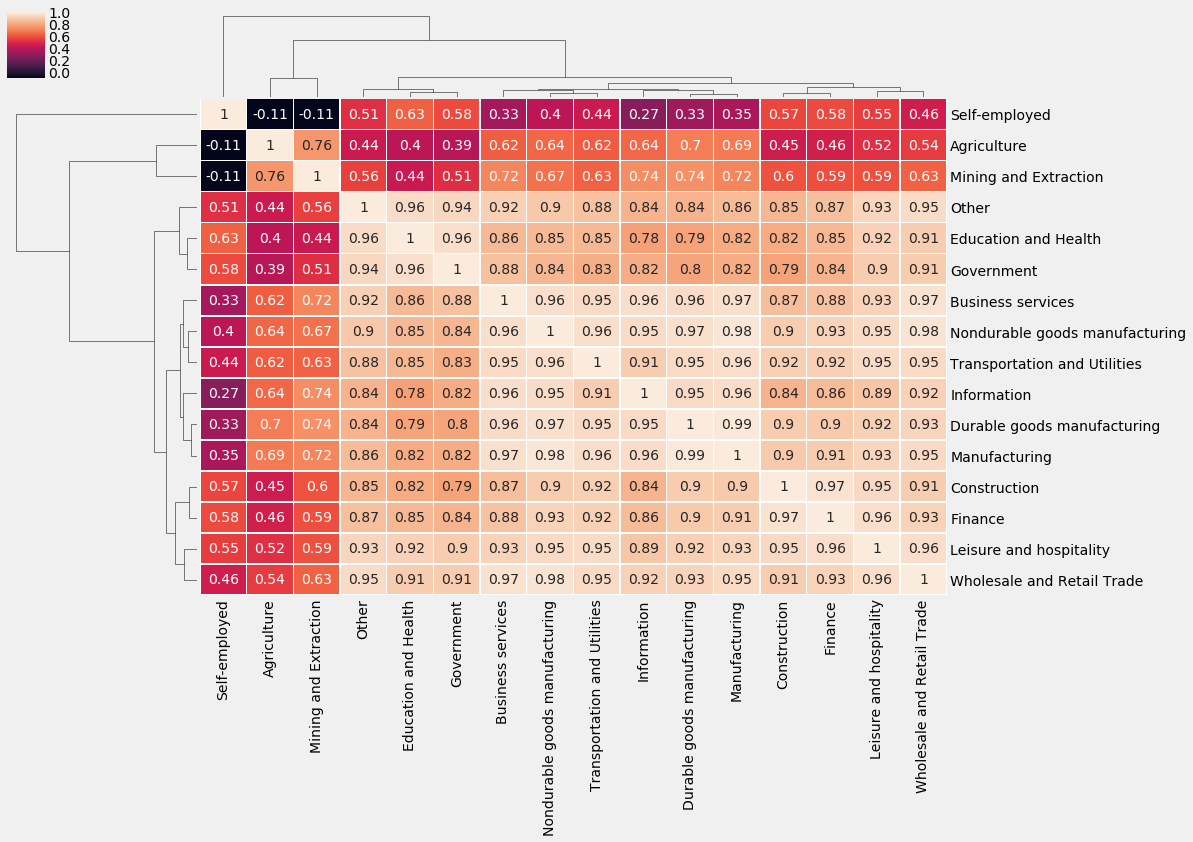
Plotting a clustermap of the jobs correlation matrix

# Get correlation matrix of the seasonality_df DataFrame
trend_corr = trend_df.corr(method='spearman')

# Customize the clustermap of the seasonality_corr
correlation matrix
fig = sns.clustermap(trend_corr, annot=True, linewidth=0.4)

plt.setp(fig.ax_heatmap.yaxis.get_majorticklabels(),
rotation=0)

plt.setp(fig.ax_heatmap.xaxis.get_majorticklabels(),
rotation=90)
Trực quan hóa dữ liệu chuỗi thời gian trong Python

The jobs correlation matrix

The jobs correlation matrix

Trực quan hóa dữ liệu chuỗi thời gian trong Python

Let's practice!

Trực quan hóa dữ liệu chuỗi thời gian trong Python

Preparing Video For Download...