Plot aggregates of your data

Trực quan hóa dữ liệu chuỗi thời gian trong Python

Thomas Vincent

Head of Data Science, Getty Images

Moving averages

  • In the field of time series analysis, a moving average can be used for many different purposes:
    • smoothing out short-term fluctuations
    • removing outliers
    • highlighting long-term trends or cycles.
Trực quan hóa dữ liệu chuỗi thời gian trong Python

The moving average model

co2_levels_mean = co2_levels.rolling(window=52).mean()

ax = co2_levels_mean.plot()
ax.set_xlabel("Date")
ax.set_ylabel("The values of my Y axis")
ax.set_title("52 weeks rolling mean of my time series")

plt.show()
Trực quan hóa dữ liệu chuỗi thời gian trong Python

A plot of the moving average for the CO2 data
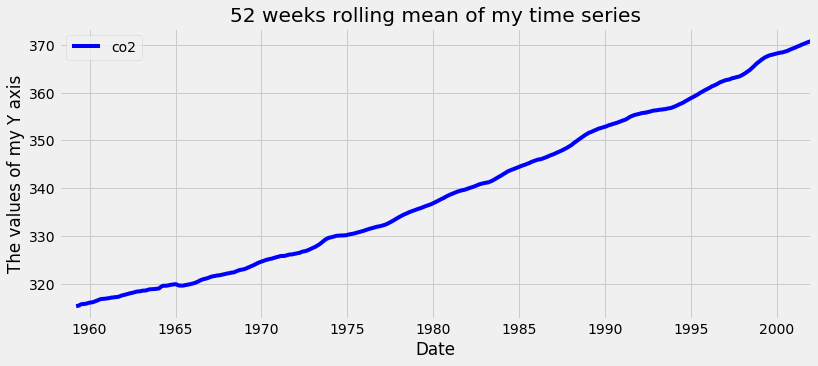
Rolling mean of a time series

Trực quan hóa dữ liệu chuỗi thời gian trong Python

Computing aggregate values of your time series
co2_levels.index
DatetimeIndex(['1958-03-29', '1958-04-05',...],
              dtype='datetime64[ns]', name='datestamp', 
              length=2284, freq=None)
print(co2_levels.index.month)
array([ 3,  4,  4, ..., 12, 12, 12], dtype=int32)
print(co2_levels.index.year)
array([1958, 1958, 1958, ..., 2001,
      2001, 2001], dtype=int32)
Trực quan hóa dữ liệu chuỗi thời gian trong Python

Plotting aggregate values of your time series

index_month = co2_levels.index.month
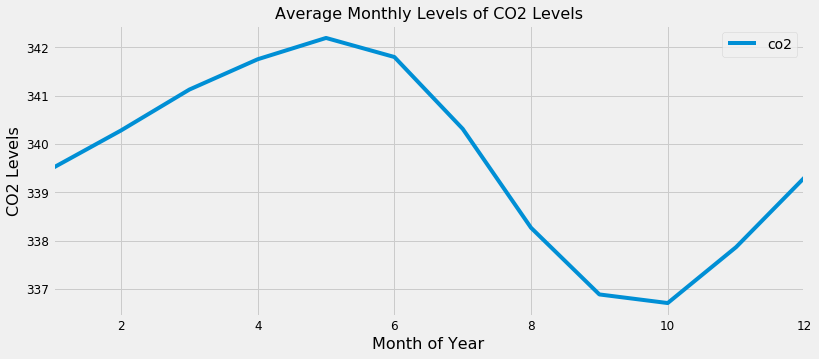
co2_levels_by_month = co2_levels.groupby(index_month).mean()
co2_levels_by_month.plot()

plt.show()
Trực quan hóa dữ liệu chuỗi thời gian trong Python

Plotting aggregate values of your time series

Monthly aggregates of the CO2 levels data

Trực quan hóa dữ liệu chuỗi thời gian trong Python

Let's practice!

Trực quan hóa dữ liệu chuỗi thời gian trong Python

Preparing Video For Download...