Trực quan hóa dữ liệu chuỗi thời gian trong Python
Thomas Vincent
Head of Data Science, Getty Images
plt aliasimport matplotlib.pyplot as plt

import matplotlib.pyplot as plt
import pandas as pd
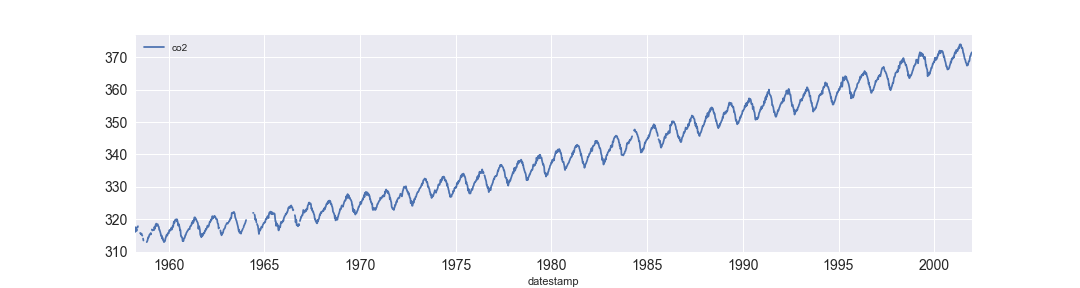
df = df.set_index('date_column')
df.plot()
plt.show()
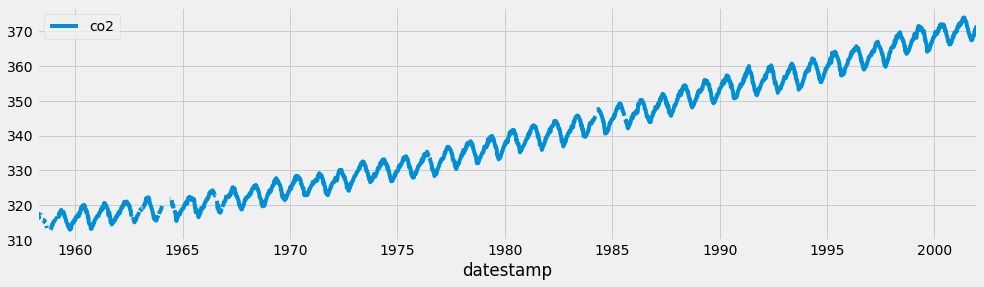
plt.style.use('fivethirtyeight')
df.plot()
plt.show()

print(plt.style.available)
['seaborn-dark-palette', 'seaborn-darkgrid',
'seaborn-dark', 'seaborn-notebook',
'seaborn-pastel', 'seaborn-white',
'classic', 'ggplot', 'grayscale',
'dark_background', 'seaborn-poster',
'seaborn-muted', 'seaborn', 'bmh',
'seaborn-paper', 'seaborn-whitegrid',
'seaborn-bright', 'seaborn-talk',
'fivethirtyeight', 'seaborn-colorblind',
'seaborn-deep', 'seaborn-ticks']
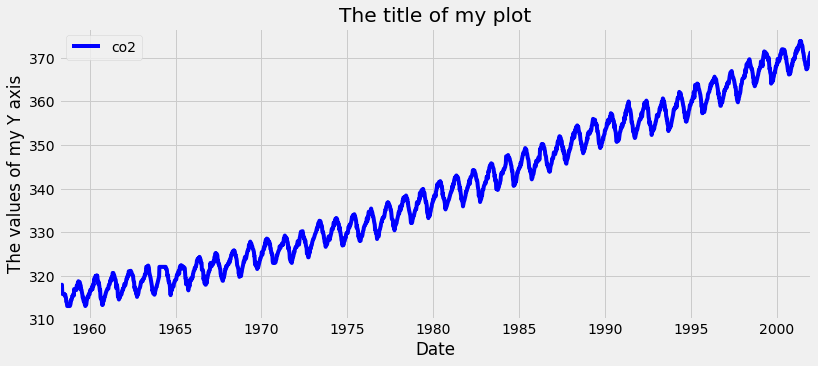
ax = df.plot(color='blue')
ax.set_xlabel('Date')
ax.set_ylabel('The values of my Y axis')
ax.set_title('The title of my plot')
plt.show()

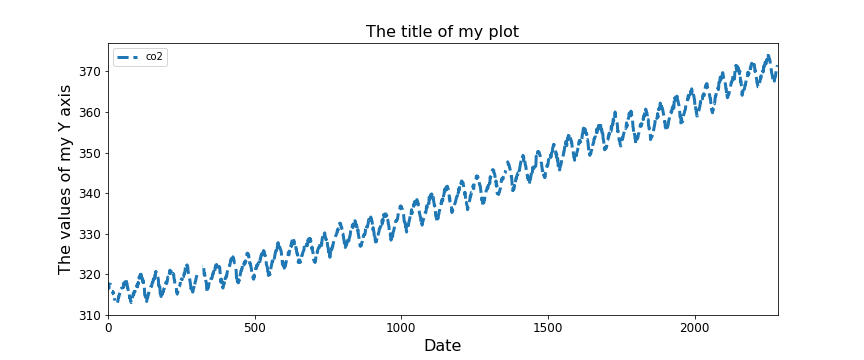
ax = df.plot(figsize=(12, 5), fontsize=12,
linewidth=3, linestyle='--')
ax.set_xlabel('Date', fontsize=16)
ax.set_ylabel('The values of my Y axis', fontsize=16)
ax.set_title('The title of my plot', fontsize=16)
plt.show()

Trực quan hóa dữ liệu chuỗi thời gian trong Python