Trực quan hóa dữ liệu chuỗi thời gian trong Python
Thomas Vincent
Head of Data Science, Getty Images

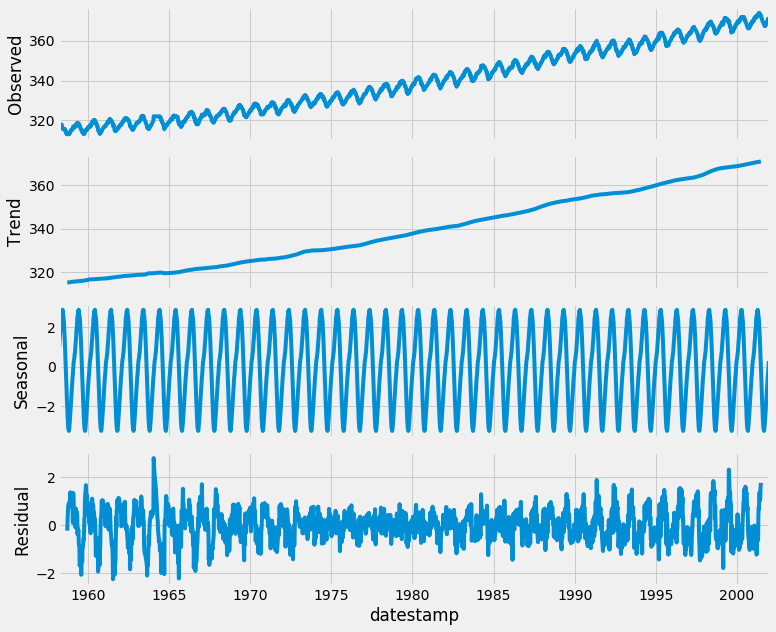
import statsmodels.api as sm
import matplotlib.pyplot as plt
from pylab import rcParams
rcParams['figure.figsize'] = 11, 9
decomposition = sm.tsa.seasonal_decompose(
co2_levels['co2'])
fig = decomposition.plot()
plt.show()

print(dir(decomposition))
['__class__', '__delattr__', '__dict__',
... 'plot', 'resid', 'seasonal', 'trend']
print(decomposition.seasonal)
datestamp
1958-03-29 1.028042
1958-04-05 1.235242
1958-04-12 1.412344
1958-04-19 1.701186
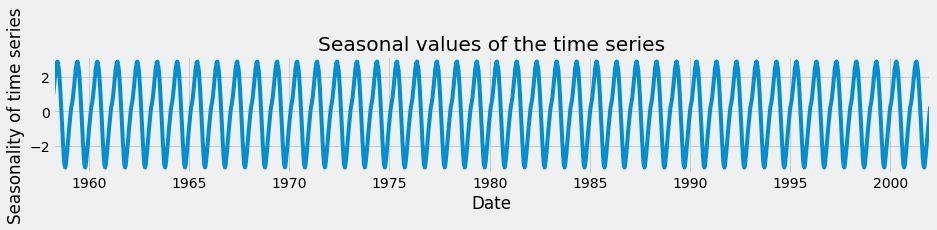
decomp_seasonal = decomposition.seasonal
ax = decomp_seasonal.plot(figsize=(14, 2))
ax.set_xlabel('Date')
ax.set_ylabel('Tính mùa vụ của chuỗi thời gian')
ax.set_title('Giá trị mùa vụ của chuỗi thời gian')
plt.show()

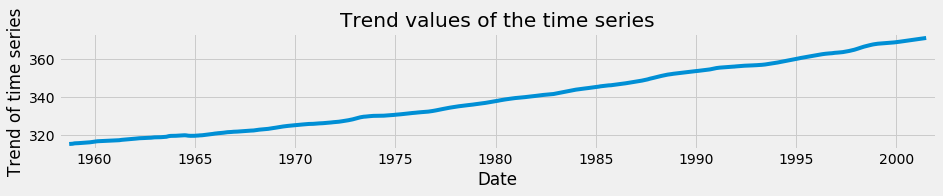
decomp_trend = decomposition.trend
ax = decomp_trend.plot(figsize=(14, 2))
ax.set_xlabel('Date')
ax.set_ylabel('Xu hướng của chuỗi thời gian')
ax.set_title('Giá trị xu hướng của chuỗi thời gian')
plt.show()

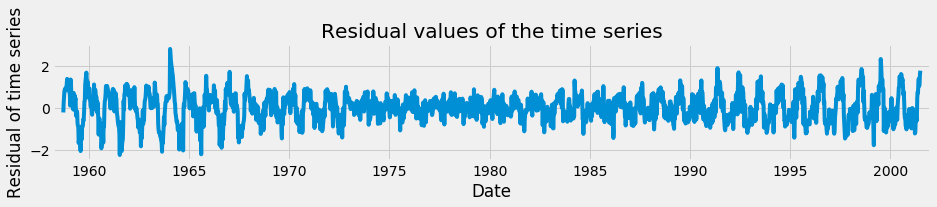
decomp_resid = decomp.resid
ax = decomp_resid.plot(figsize=(14, 2))
ax.set_xlabel('Date')
ax.set_ylabel('Phần dư của chuỗi thời gian')
ax.set_title('Giá trị phần dư của chuỗi thời gian')
plt.show()

Trực quan hóa dữ liệu chuỗi thời gian trong Python