Summarizing the values in your time series data

Trực quan hóa dữ liệu chuỗi thời gian trong Python

Thomas Vincent

Head of Data Science, Getty Images

Obtaining numerical summaries of your data

  • What is the average value of this data?
  • What is the maximum value observed in this time series?
Trực quan hóa dữ liệu chuỗi thời gian trong Python

The .describe() method automatically computes key statistics of all numeric columns in your DataFrame

print(df.describe())
               co2
count  2284.000000
mean    339.657750
std      17.100899
min     313.000000
25%     323.975000
50%     337.700000
75%     354.500000
max     373.900000
Trực quan hóa dữ liệu chuỗi thời gian trong Python

Summarizing your data with boxplots

ax1 = df.boxplot()
ax1.set_xlabel('Your first boxplot')
ax1.set_ylabel('Values of your data')
ax1.set_title('Boxplot values of your data')

plt.show()
Trực quan hóa dữ liệu chuỗi thời gian trong Python

A boxplot of the values in the CO2 data
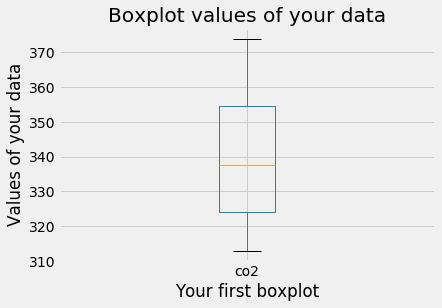
Boxplot of your time series

Trực quan hóa dữ liệu chuỗi thời gian trong Python

Summarizing your data with histograms

ax2 = df.plot(kind='hist', bins=100)
ax2.set_xlabel('Your first histogram')
ax2.set_ylabel('Frequency of values in your data')
ax2.set_title('Histogram of your data with 100 bins')

plt.show()
Trực quan hóa dữ liệu chuỗi thời gian trong Python

A histogram plot of the values in the CO2 data
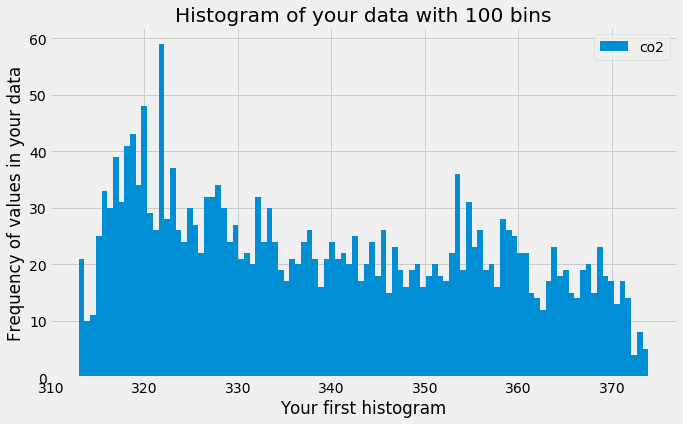
Histogram with 100 bins

Trực quan hóa dữ liệu chuỗi thời gian trong Python

Summarizing your data with density plots

ax3 = df.plot(kind='density', linewidth=2)
ax3.set_xlabel('Your first density plot')
ax3.set_ylabel('Density values of your data')
ax3.set_title('Density plot of your data')

plt.show()
Trực quan hóa dữ liệu chuỗi thời gian trong Python

A density plot of the values in the CO2 data
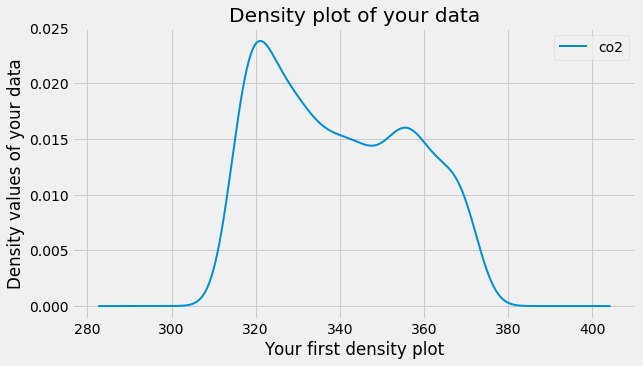
Density plot of your data

Trực quan hóa dữ liệu chuỗi thời gian trong Python

Let's practice!

Trực quan hóa dữ liệu chuỗi thời gian trong Python

Preparing Video For Download...