Customize your time series plot

Trực quan hóa dữ liệu chuỗi thời gian trong Python

Thomas Vincent

Head of Data Science, Getty Images

Slicing time series data

discoveries['1960':'1970']
discoveries['1950-01':'1950-12']
discoveries['1960-01-01':'1960-01-15']
Trực quan hóa dữ liệu chuỗi thời gian trong Python

Plotting subset of your time series data
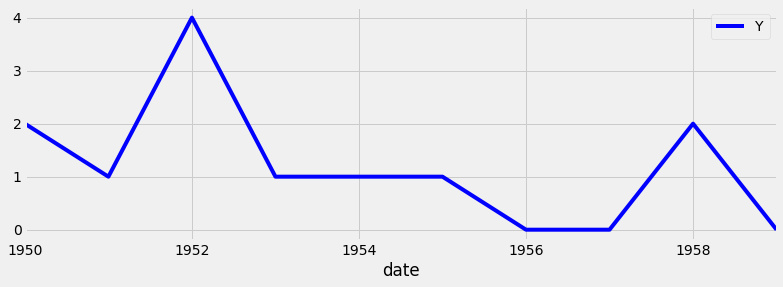
import matplotlib.pyplot as plt
plt.style.use('fivethirtyeight')
df_subset = discoveries['1960':'1970']
ax = df_subset.plot(color='blue', fontsize=14)
plt.show()

Time series subset example

Trực quan hóa dữ liệu chuỗi thời gian trong Python

Adding markers

ax.axvline(x='1969-01-01', 
           color='red', 
           linestyle='--')
ax.axhline(y=100, 
           color='green', 
           linestyle='--')
Trực quan hóa dữ liệu chuỗi thời gian trong Python

Using markers: the full code

ax = discoveries.plot(color='blue')
ax.set_xlabel('Date')
ax.set_ylabel('Number of great discoveries')

ax.axvline('1969-01-01', color='red', linestyle='--') ax.axhline(4, color='green', linestyle='--')
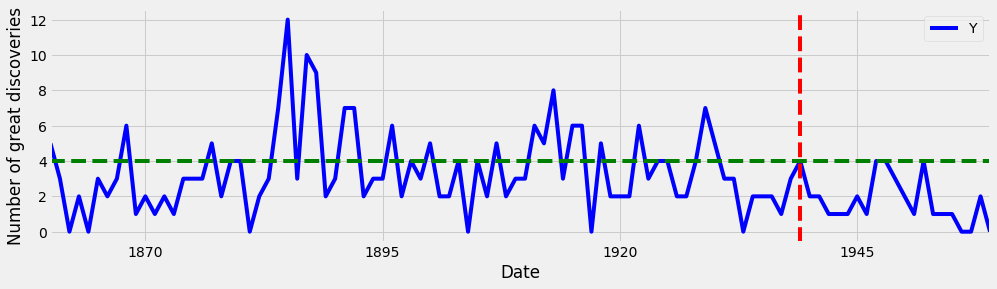
Adding markers to your plot

Trực quan hóa dữ liệu chuỗi thời gian trong Python

Highlighting regions of interest

ax.axvspan('1964-01-01', '1968-01-01', 
           color='red', alpha=0.5)
ax.axhspan(8, 6, color='green',
           alpha=0.2)
Trực quan hóa dữ liệu chuỗi thời gian trong Python

Highlighting regions of interest: the full code
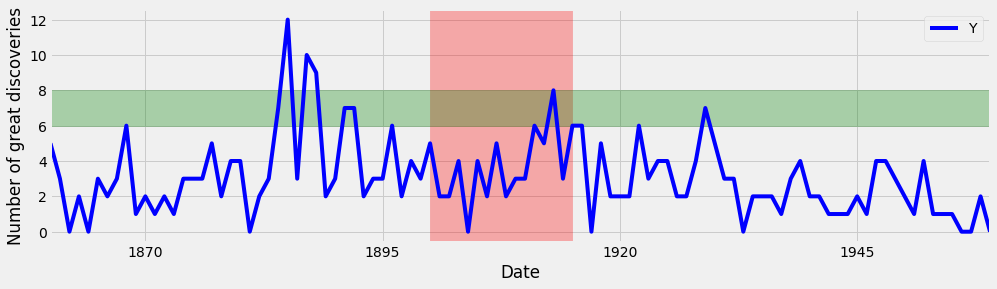
ax = discoveries.plot(color='blue')
ax.set_xlabel('Date')
ax.set_ylabel('Number of great discoveries')
ax.axvspan('1964-01-01', '1968-01-01', color='red',
alpha=0.3)
ax.axhspan(8, 6, color='green', alpha=0.3)

Adding regions of interest to your plot

Trực quan hóa dữ liệu chuỗi thời gian trong Python

Let's practice!

Trực quan hóa dữ liệu chuỗi thời gian trong Python

Preparing Video For Download...