Working with more than one time series

Trực quan hóa dữ liệu chuỗi thời gian trong Python

Thomas Vincent

Head of Data Science, Getty Images

Working with multiple time series

An isolated time series

date ts1
1949-01 112
1949-02 118
1949-03 132

A file with multiple time series

date ts1 ts2 ts3 ts4 ts5 ts6 ts7
2012-01-01 2113.8 10.4 1987.0 12.1 3091.8 43.2 476.7
2012-02-01 2009.0 9.8 1882.9 12.3 2954.0 38.8 466.8
2012-03-01 2159.8 10.0 1987.9 14.3 3043.7 40.1 502.1
Trực quan hóa dữ liệu chuỗi thời gian trong Python

The Meat production dataset

import pandas as pd
meat = pd.read_csv("meat.csv")
print(meat.head(5))
         date   beef   veal    pork  lamb_and_mutton  broilers   
0  1944-01-01  751.0   85.0  1280.0             89.0       NaN 
1  1944-02-01  713.0   77.0  1169.0             72.0       NaN 
2  1944-03-01  741.0   90.0  1128.0             75.0       NaN 
3  1944-04-01  650.0   89.0   978.0             66.0       NaN 
4  1944-05-01  681.0  106.0  1029.0             78.0       NaN 

   other_chicken  turkey  
0            NaN     NaN  
1            NaN     NaN  
2            NaN     NaN  
3            NaN     NaN  
4            NaN     NaN
Trực quan hóa dữ liệu chuỗi thời gian trong Python

Summarizing and plotting multiple time series

import matplotlib.pyplot as plt
plt.style.use('fivethirtyeight')
ax = df.plot(figsize=(12, 4), fontsize=14)

plt.show()
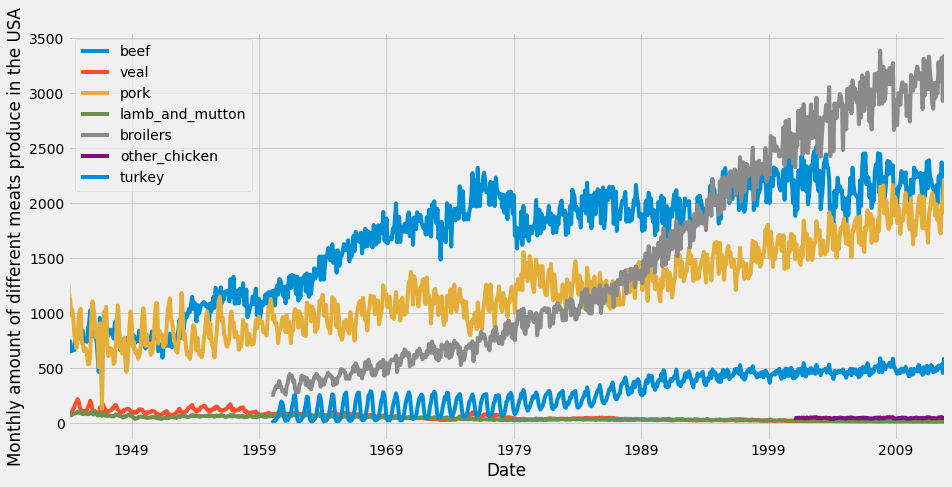
The Meat production dataset

Trực quan hóa dữ liệu chuỗi thời gian trong Python

Area charts

import matplotlib.pyplot as plt
plt.style.use('fivethirtyeight')
ax = df.plot.area(figsize=(12, 4), fontsize=14)

plt.show()
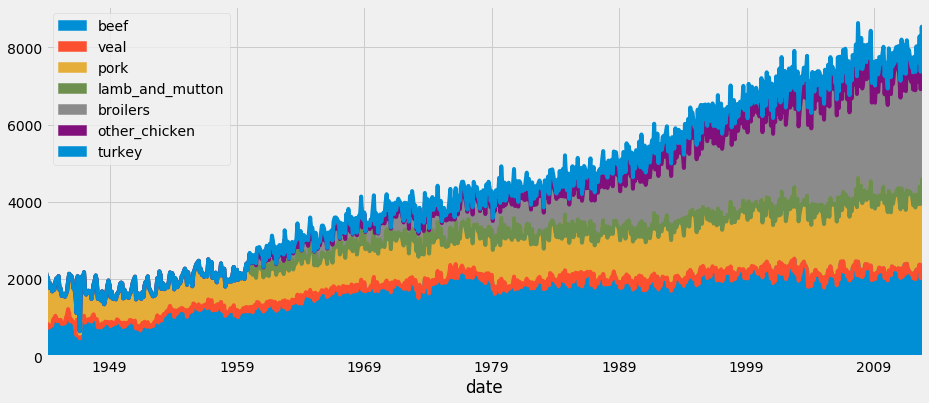
The Meat production dataset as an Area Chart

Trực quan hóa dữ liệu chuỗi thời gian trong Python

Let's practice!

Trực quan hóa dữ liệu chuỗi thời gian trong Python

Preparing Video For Download...