Nhập môn Trực quan hóa Dữ liệu với Plotly trong Python
Alex Scriven
Data Scientist
$$

$$
add_annotation()$$
update_layout() với tham số annotationstext - Văn bản hiển thị$$
x và y: vị trí chú thích$$
showarrow = True/False - bật/tắt mũi tên$$
🛑 Cẩn thận khi đặt chú thích tuyệt đối - dữ liệu thay đổi có thể gây chồng lấp
x và y là giá trị dữ liệu trong biểu đồ$$
xref và yref là paper để định vị tuyệt đốix và y là phần trăm từ 0 đến 1 trong vùng vẽx=0.5, y=0.5) là giữa biểu đồ
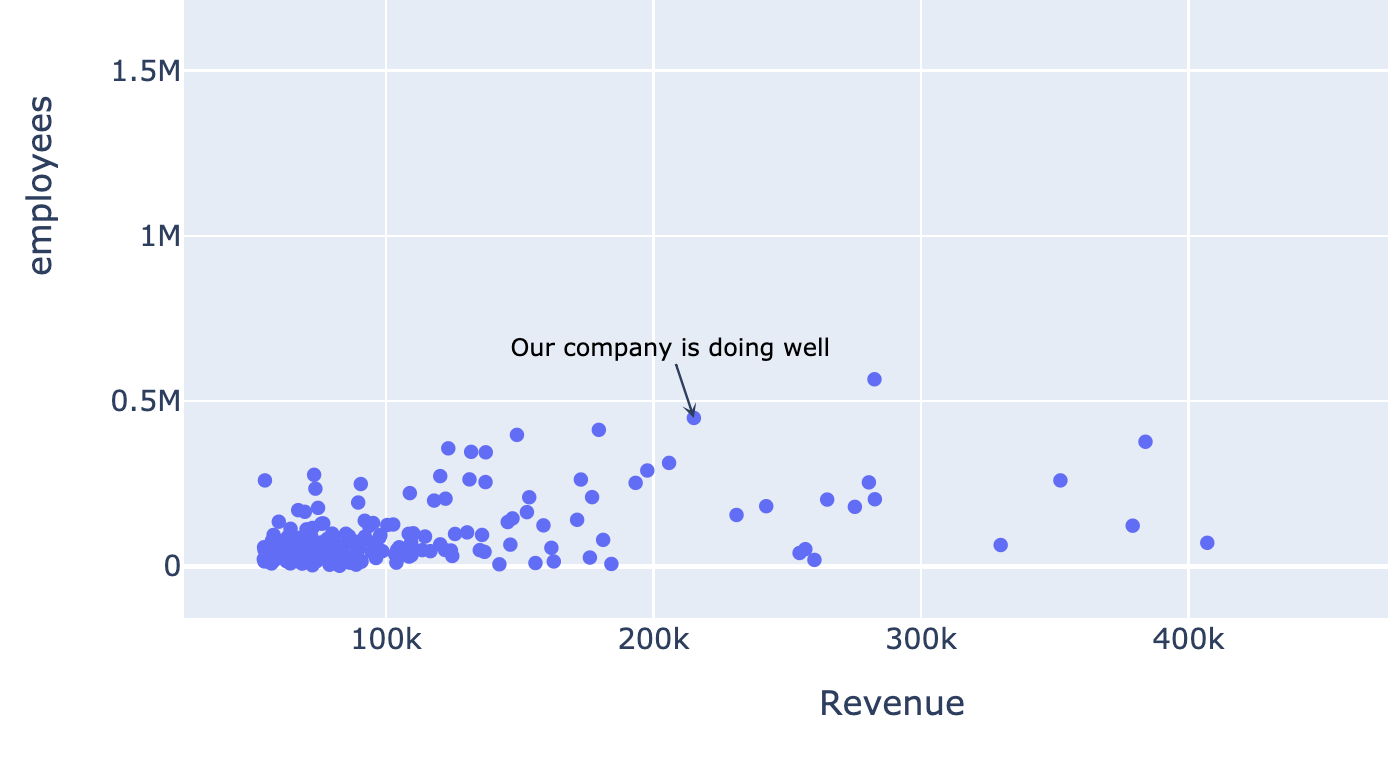
my_annotation = dict( x=215111, y=449000,showarrow=True, arrowhead=3,text="Our company is doing well", font=dict(size=10, color="black") )fig.update_layout(annotations=[my_annotation]) fig.show()
$$

$$
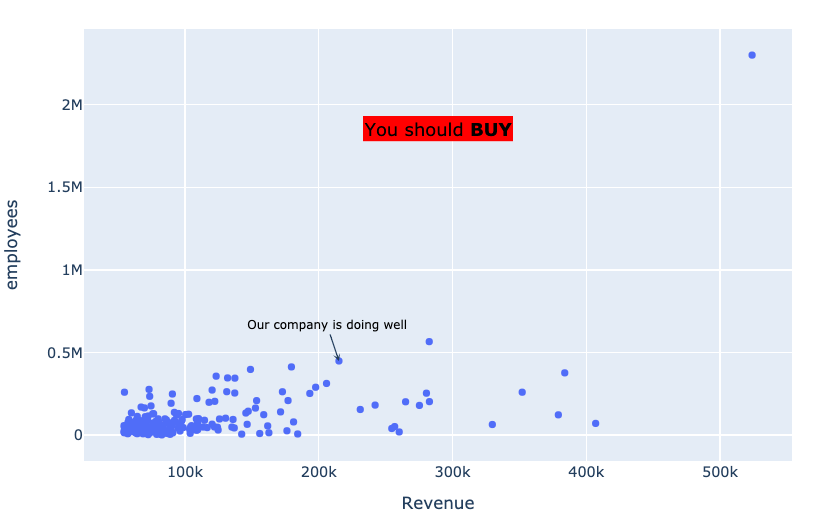
float_annotation = dict( xref="paper", yref="paper",x=0.5, y=0.8,showarrow=False, text="You should <b>BUY</b>", font=dict(size=15, color="black"), bgcolor="rgb(255,0,0)" )

Nhập môn Trực quan hóa Dữ liệu với Plotly trong Python