Nhập môn Trực quan hóa Dữ liệu với Plotly trong Python
Alex Scriven
Data Scientist
Phần tử tương tác để chuyển giữa các giá trị và cập nhật biểu đồ
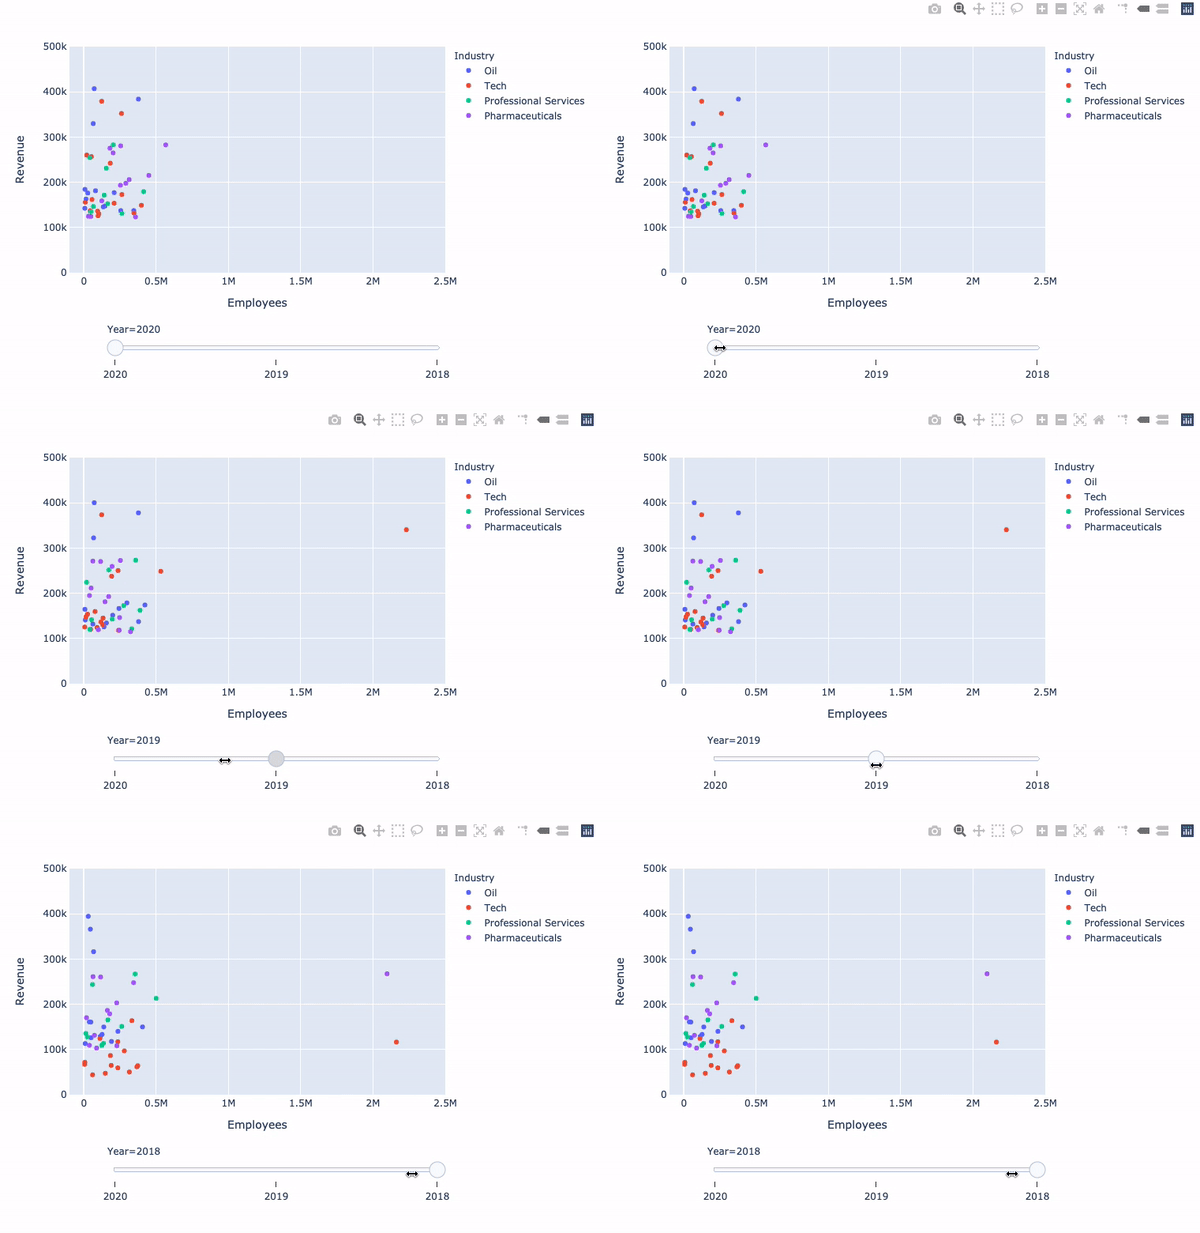
Dùng để xem dữ liệu theo thời gian
Có thể áp dụng cho bất kỳ nhóm nào
$$
$$
$$
Thanh trượt theo năm:

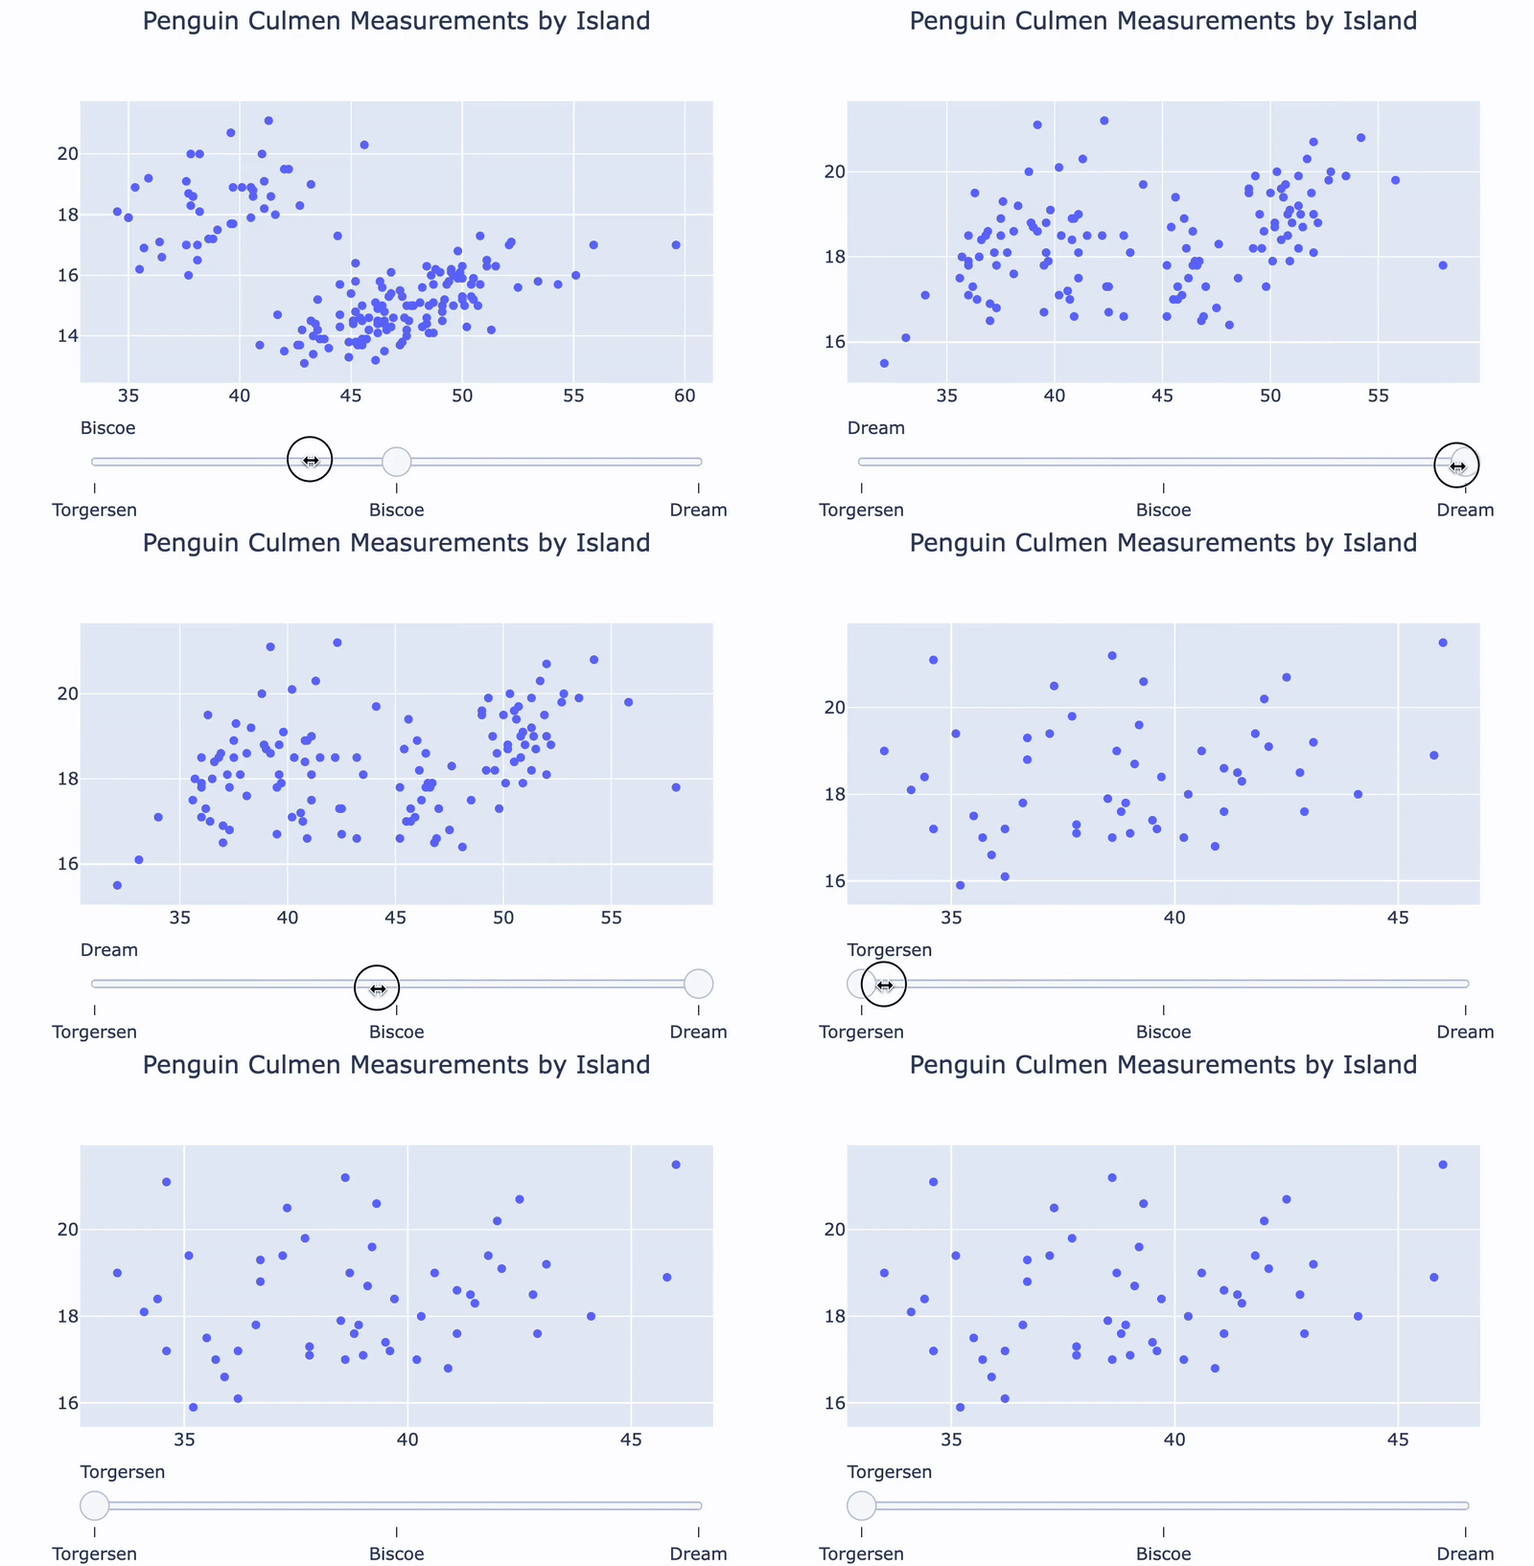
Thanh trượt theo đảo chim cánh cụt:

animation_frame: Nội dung trên slider (Year hoặc Island ở trang trước)$$
animation_group: Xác định mẫu nào giữ nguyên qua các framefig = px.scatter( data_frame=revenues, y='Revenue', x='Employees', color='Industry',animation_frame='Year', animation_group='Company')fig.update_layout({ 'yaxis': {'range': [0, 500000]}, 'xaxis': {'range': [-100000, 2500000]} })fig['layout'].pop('updatemenus') fig.show()

plotly.express dùng phương thức animate để tạo slider
$$
fig['layout']['sliders'][0].steps[0]['method']
animate
$$
fig = go.Figure()for island in ['Torgersen', 'Biscoe', 'Dream']: df = penguins[penguins.Island == island]temp_trace = px.scatter(df, x="Culmen Length (mm)", y="Culmen Depth (mm)") fig.add_trace(temp_trace.data[0])
sliders = [ {'steps':[{'method': 'update', 'label': 'Torgersen','args': [{'visible': [True, False, False]}]},{'method': 'update', 'label': 'Bisco','args': [{'visible': [False, True, False]}]},{'method': 'update', 'label': 'Dream','args': [{'visible': [False, False, True]}]}]} ]
$$
Nhiều tùy chọn định dạng khác trong tài liệu
$$
fig.update_layout({'sliders': sliders})
fig.show()

Nhập môn Trực quan hóa Dữ liệu với Plotly trong Python