Nhập môn Trực quan hóa Dữ liệu với Plotly trong Python
Alex Scriven
Data Scientist

Các ưu điểm nổi bật của Plotly:
plotly.express
Có thể tạo biểu đồ Plotly:
plotly.express cho biểu đồ nhanh (px)plotly.graph_objects (go) để tùy biến nhiều hơn$$
📈 Chúng ta sẽ chủ yếu dùng px
Lưu các liên kết tài liệu quan trọng!
Trang tham chiếu chi tiết cho từng biểu đồ
$$
Với Scatter:
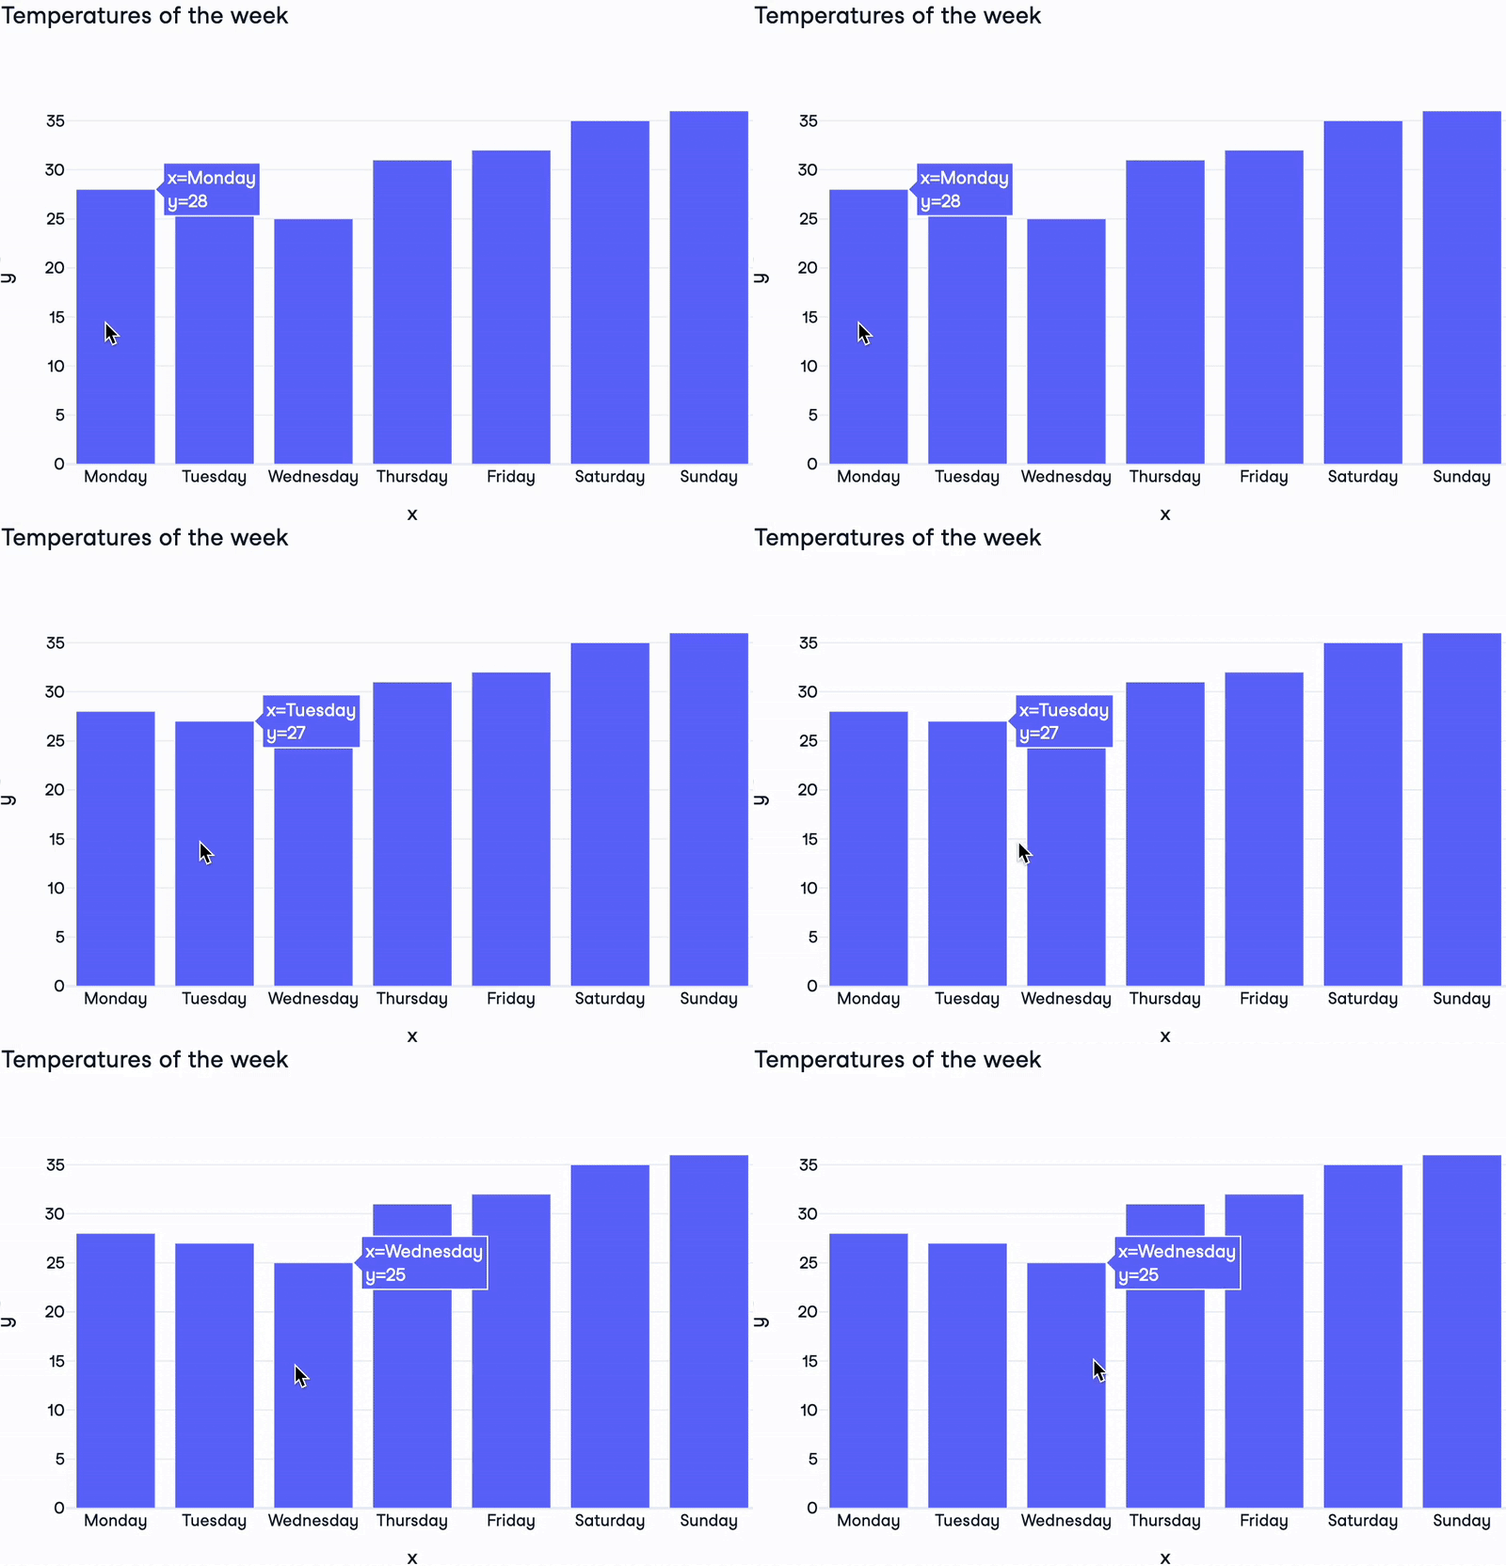
plotly.express ví dụMột figure plotly cơ bản:
import plotly.express as pxdays = ["Monday", "Tuesday", "Wednesday", "Thursday", "Friday", "Saturday", "Sunday"] temperatures = [28, 27, 25, 31, 32, 35, 36]fig = px.bar( x=days, y=temperatures, title="Temperatures of the week")fig.show()

Thành phần của Plotly Figure:
layout: Từ điển điều khiển kiểu dáng figurelayoutdata: Danh sách từ điển chỉ định kiểu biểu đồ và dữ liệutrace. Có hơn 40 kiểu!frames: Cho biểu đồ động (ngoài phạm vi khóa học)
print(fig)
Figure({'data': [{'type': 'bar',
'x': array(['Monday', 'Tuesday', 'Wednesday', 'Thursday', 'Friday'
, 'Saturday','Sunday'], dtype=object),
'y': {'bdata': 'HBsZHyAjJA==....'}],
'layout': {'title': {'text': 'Temperatures of the week'}}})
$$

Nhập môn Trực quan hóa Dữ liệu với Plotly trong Python