Nhập môn Trực quan hóa Dữ liệu với Plotly trong Python
Alex Scriven
Data Scientist
$$
$$

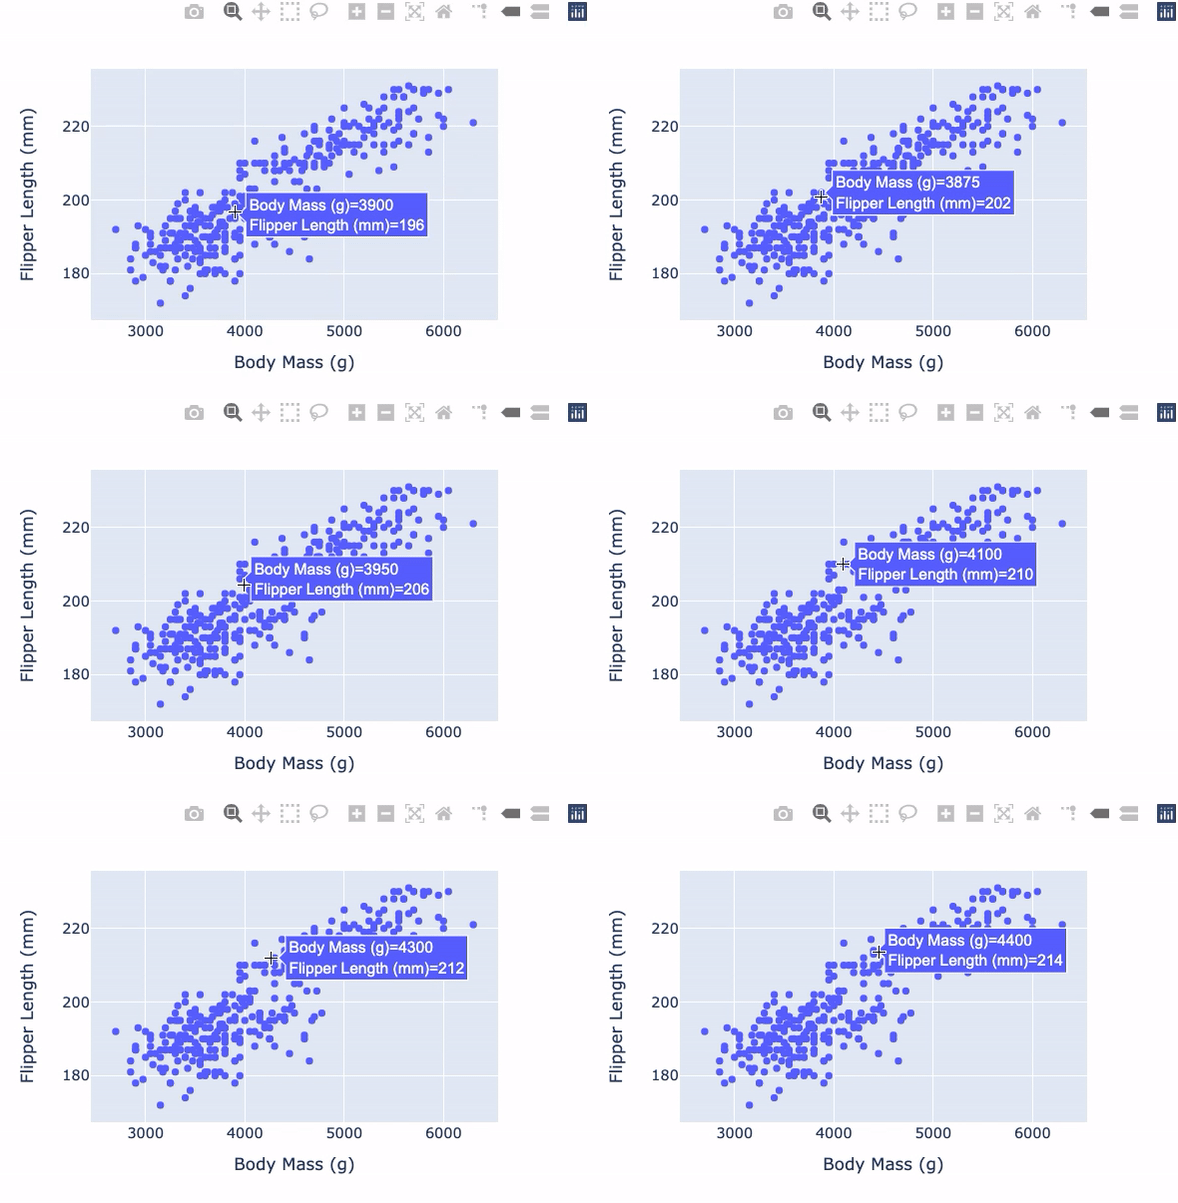
import plotly.express as pxfig = px.scatter( data_frame=penguins, x="Body Mass (g)", y="Flipper Length (mm)") fig.show()

Các tham số hữu ích của plotly.express cho scatterplot:
trendline: Thêm các loại đường xu hướngsymbol: Dùng ký hiệu khác cho từng nhóm$$
$$
$$
Xem thêm tài liệu
$$
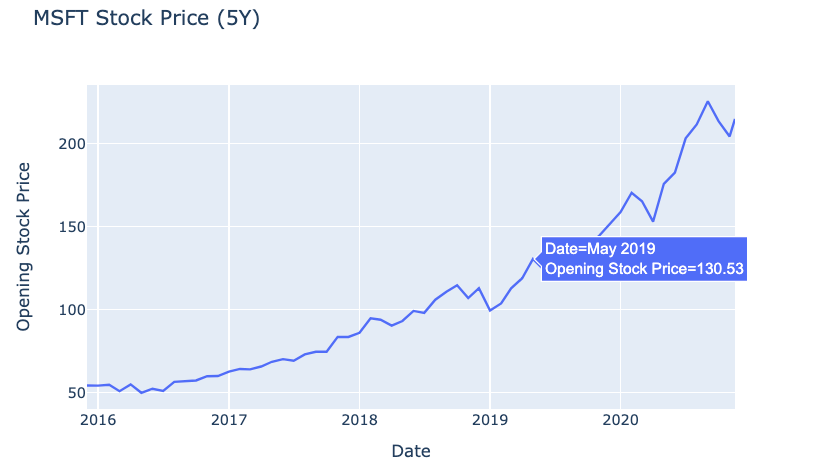
fig = px.line(
data_frame=msft_stock,
x="Date",
y="Open",
title="MSFT Stock Price (5Y)")
fig.show()
$$

$$
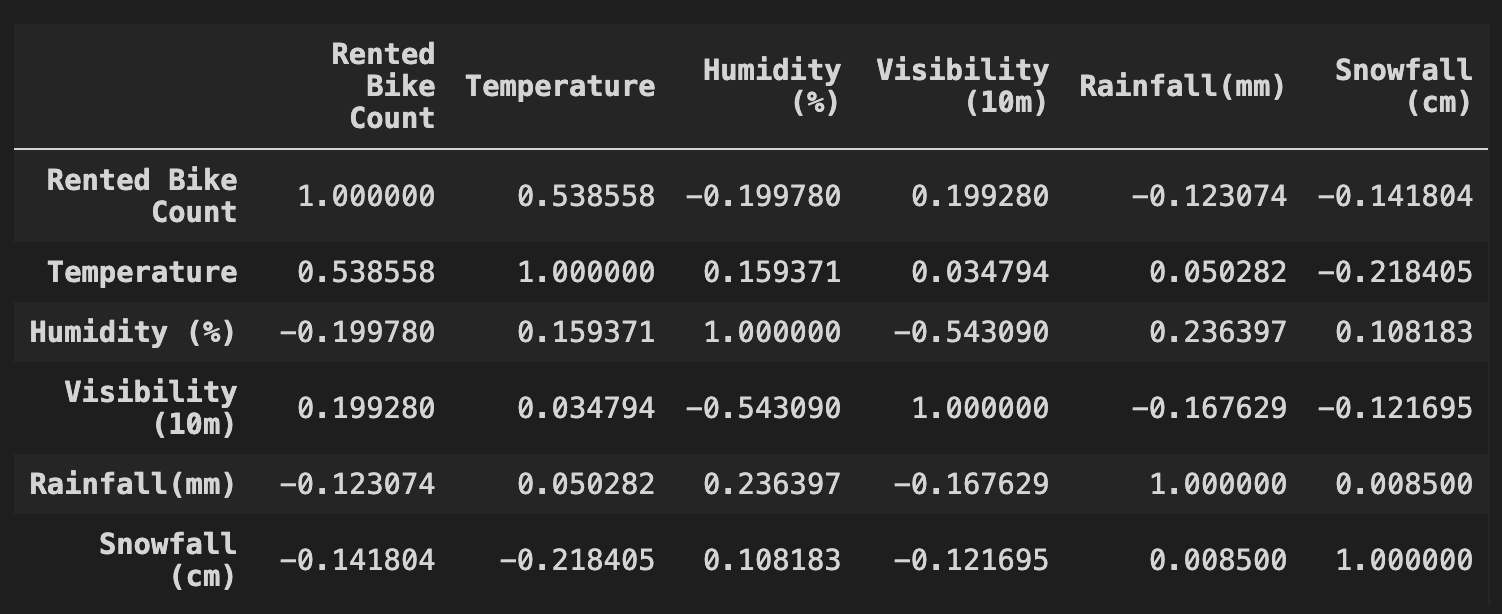
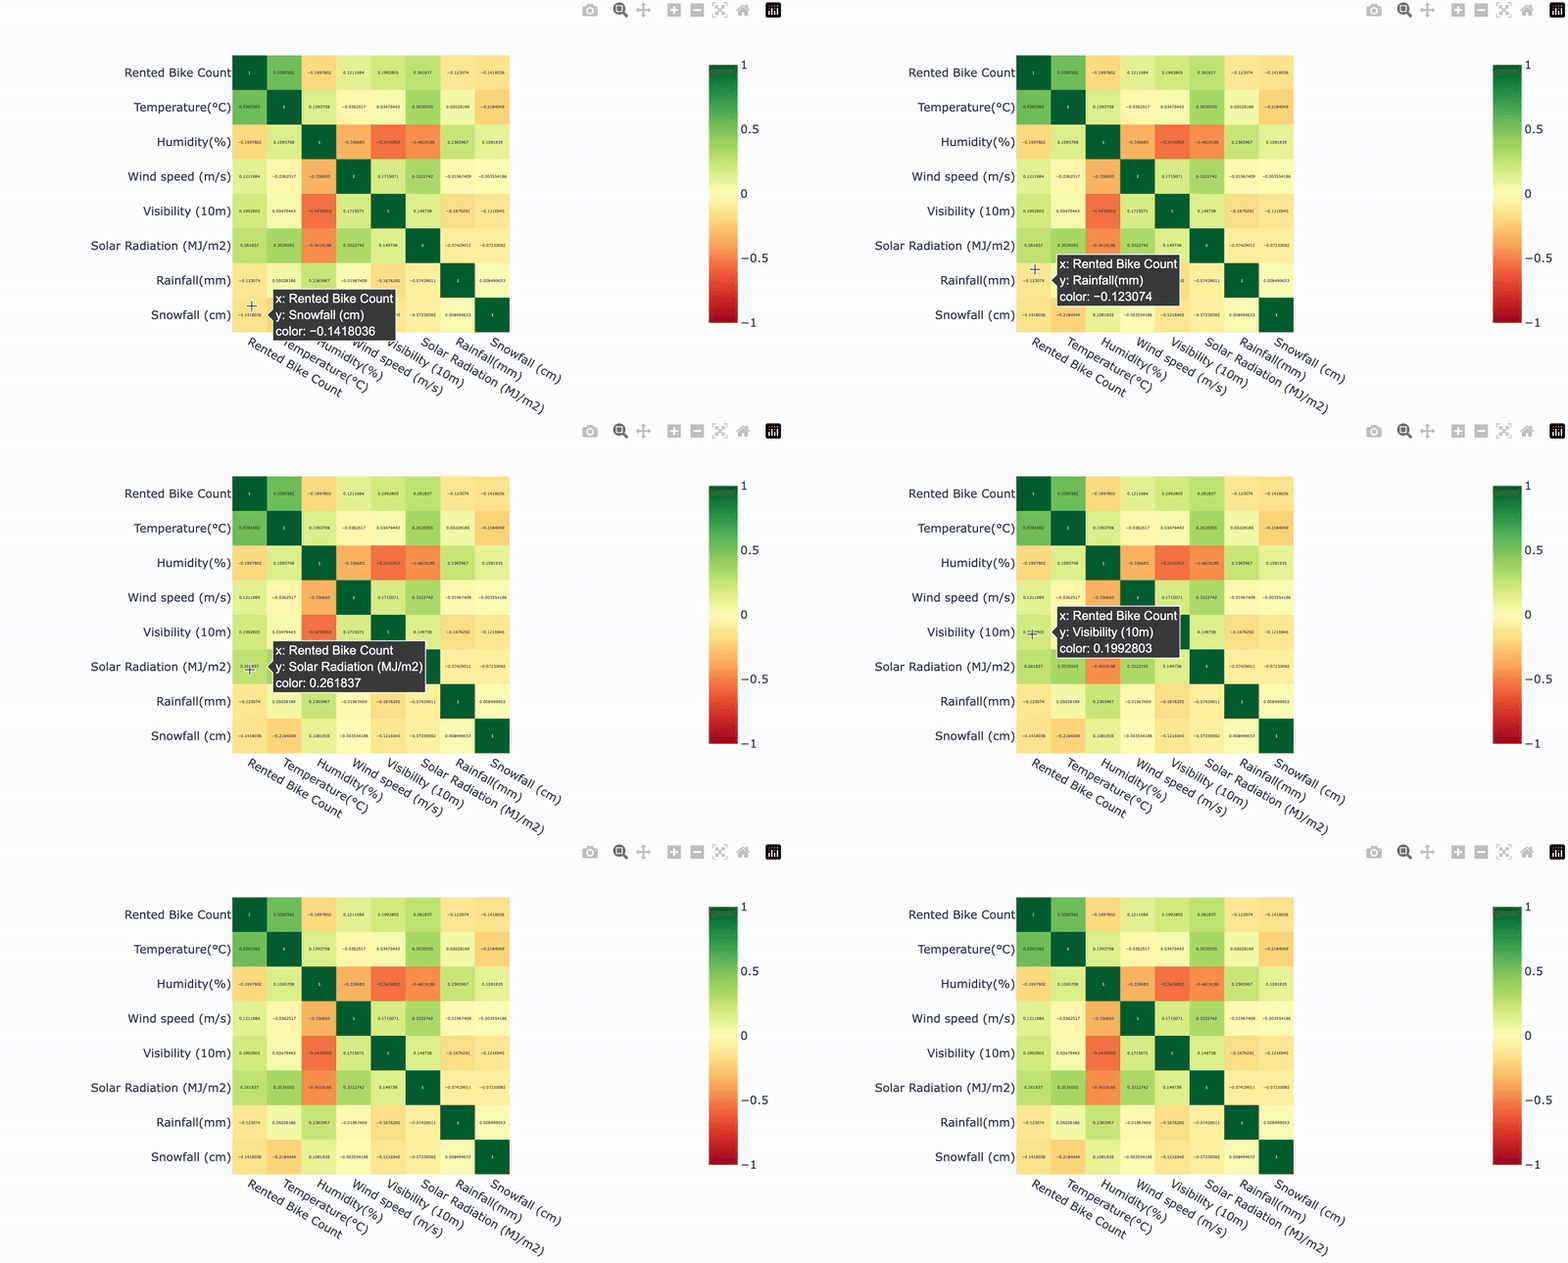
Hệ số tương quan Pearson:
df chứa dữ liệu thuê xe đạp và điều kiện thời tiết
cr = df.corr(method="pearson")
print(cr)

$$
fig = px.imshow(cr,text_auto=True,color_continuous_scale="RdYlGn", zmin=-1, zmax=1)fig.show()

Nhập môn Trực quan hóa Dữ liệu với Plotly trong Python