Biểu đồ con

Nhập môn Trực quan hóa Dữ liệu với Plotly trong Python

Alex Scriven

Data Scientist

Biểu đồ con là gì?
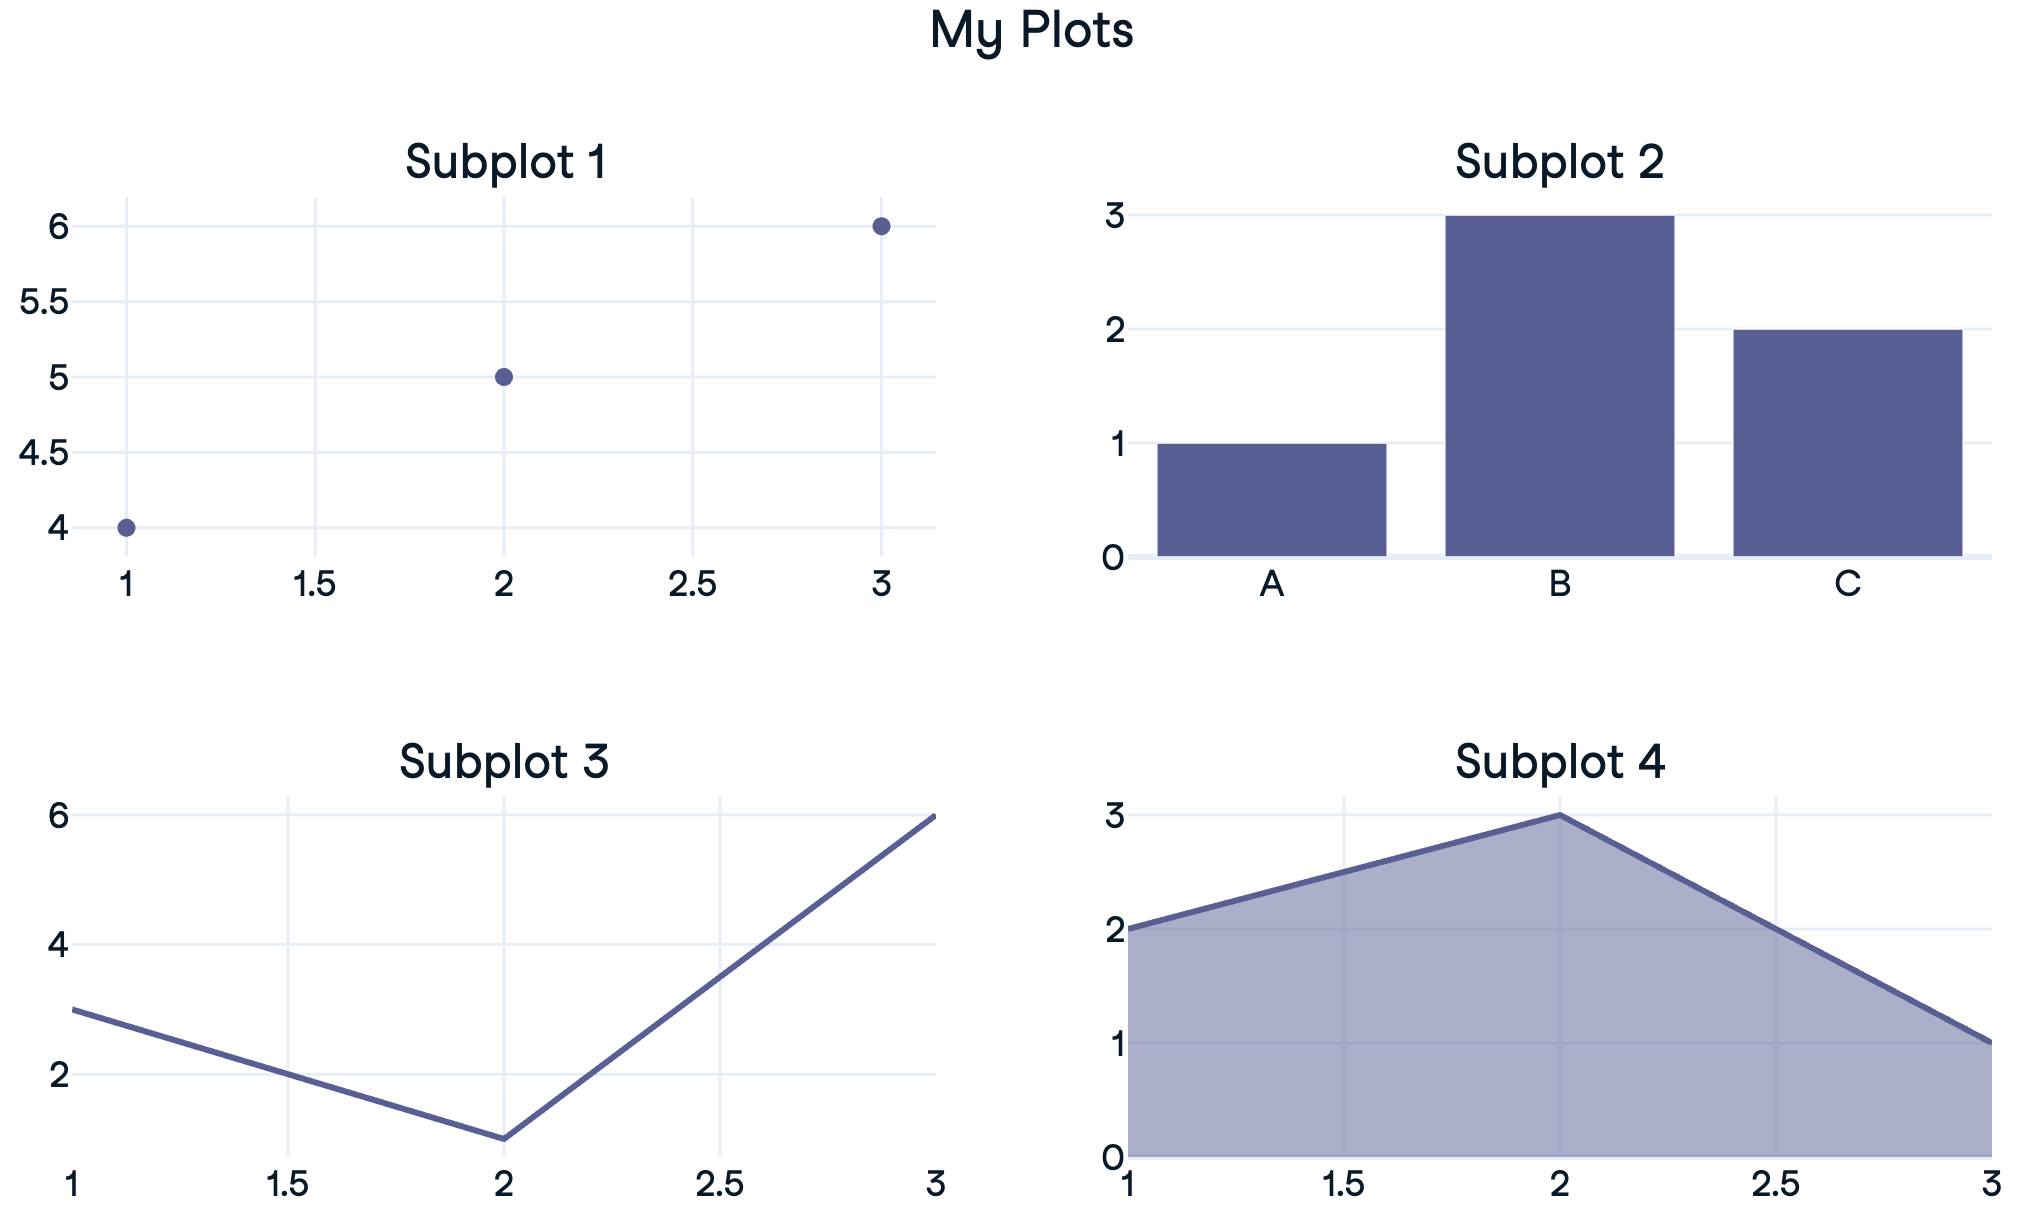
 

  • Biểu đồ con: các “biểu đồ nhỏ” trong một lưới

$$

  • Hiển thị kiểu biểu đồ khác nhau (cùng dữ liệu) hoặc các tập con dữ liệu


Phác thảo biểu đồ con

Nhập môn Trực quan hóa Dữ liệu với Plotly trong Python

Nhắc lại về traces


  • Hình Plotly chứa danh sách traces – dữ liệu và loại

  • Truy cập bằng fig.data[0], fig.data[1]

    • Có thể thêm vào biểu đồ con bằng .add_trace()

$$

px_fig = px.scatter(df...)
print(px_fig)
Figure({'data': [trace1], 'layout': {...}})
Nhập môn Trực quan hóa Dữ liệu với Plotly trong Python

Tạo biểu đồ con 1x2

import plotly.express as px
from plotly.subplots import make_subplots

# Create a subplot grid
fig = make_subplots(rows=2, cols=1)

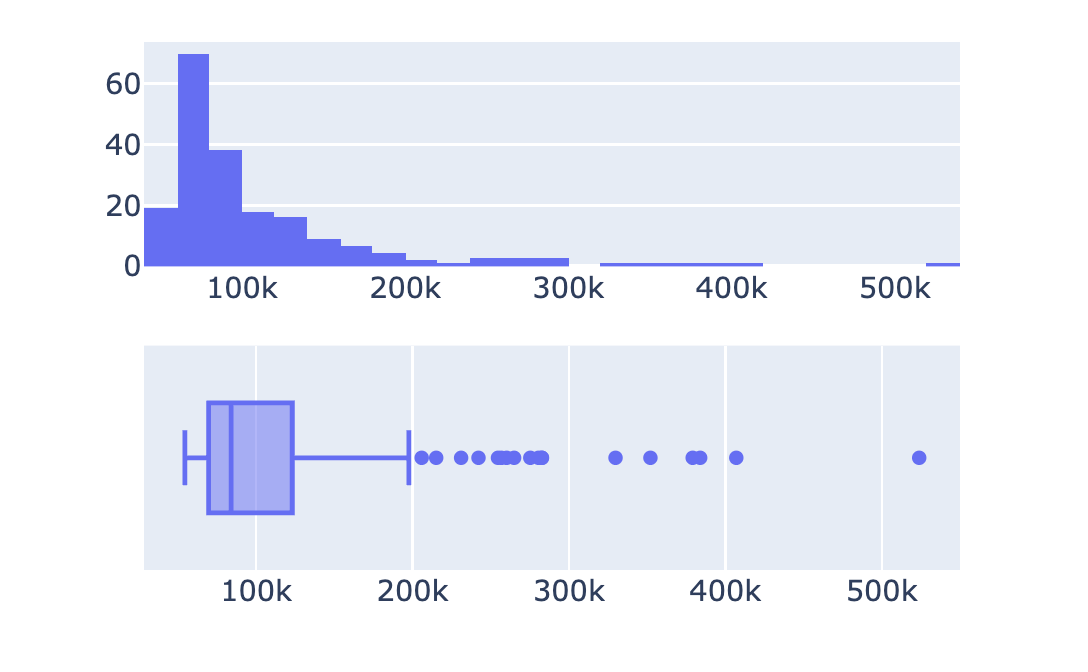
# Create plotly express figures hist = px.histogram(revenues, x='Revenue') box = px.box(revenues, x='Revenue')
# Extract traces and add to subplots fig.add_trace(hist.data[0], row=1, col=1) fig.add_trace(box.data[0], row=2, col=1) fig.show()


Một biểu đồ con tài chính

Nhập môn Trực quan hóa Dữ liệu với Plotly trong Python

Tùy chỉnh biểu đồ con


  • Chưa có tiêu đề tổng
  • Chưa có tiêu đề biểu đồ con

$$

$$

$$

  • ✨ Hãy làm cho “đáng thuyết trình”


biểu đồ con tài chính đơn giản

Nhập môn Trực quan hóa Dữ liệu với Plotly trong Python

Tiêu đề biểu đồ con

from plotly.subplots import make_subplots

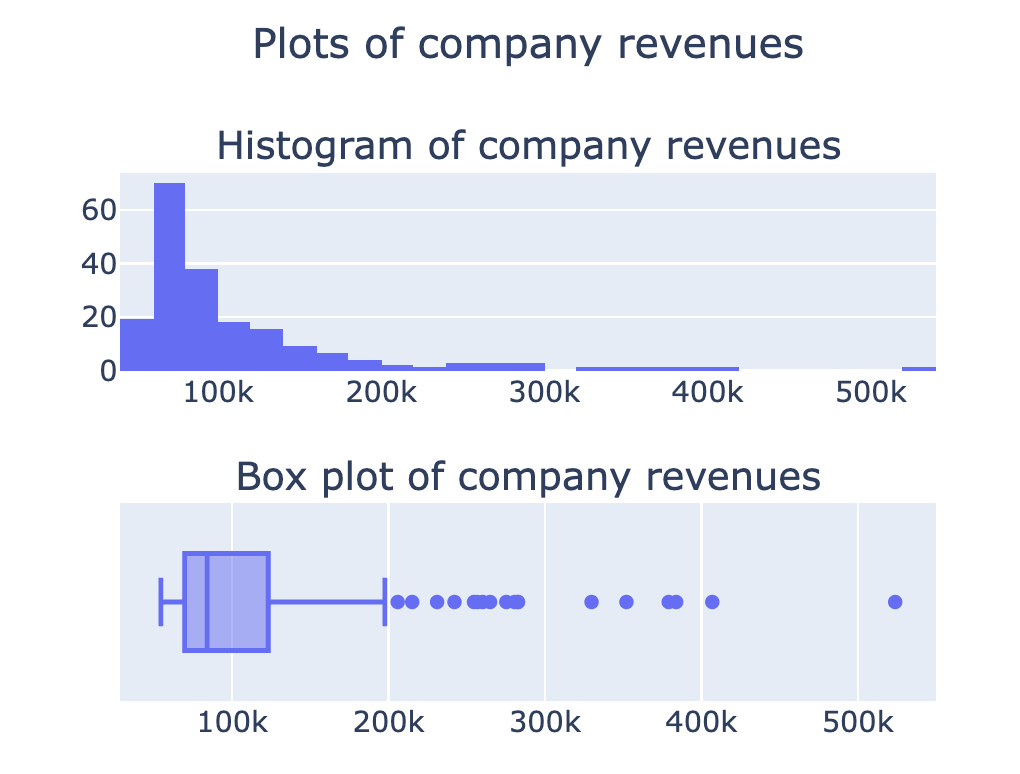
fig = make_subplots(rows=2, cols=1,
    subplot_titles=[
    'Histogram of company revenues', 
    'Box plot of company revenues'])

## Add in traces (fig.add_trace())
fig.update_layout({'title': {'text': 'Plots of company revenues', 'x': 0.5, 'y': 0.9}}) fig.show()

Đã chỉnh tiêu đề biểu đồ con

Thêm tùy chọn trong tài liệu

Nhập môn Trực quan hóa Dữ liệu với Plotly trong Python

Biểu đồ con xếp chồng

$$

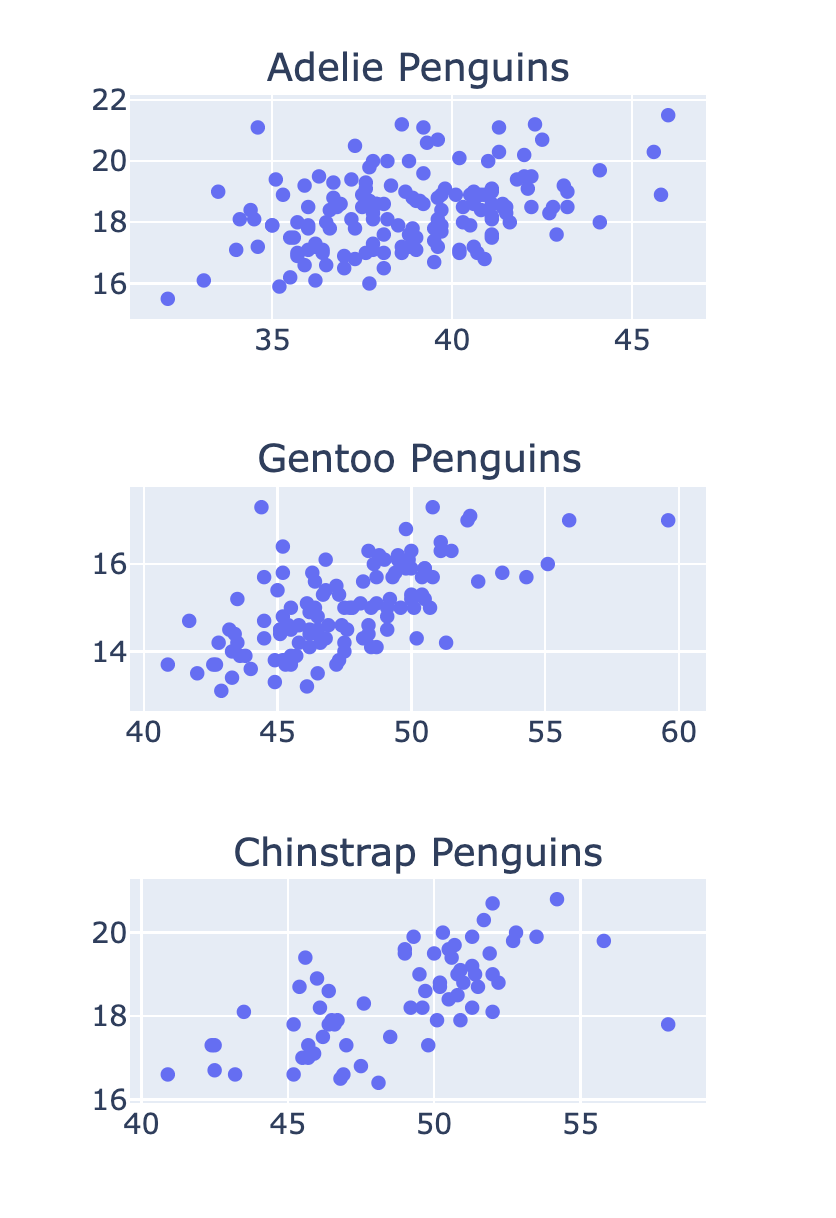
fig = make_subplots(rows=3, cols=1, 
  subplot_titles=['Adelie Penguins'
  , 'Gentoo Penguins', 'Chinstrap Penguins'])

row_num = 1 for species in ['Adelie', 'Gentoo', 'Chinstrap']: # Filter data for this species df = penguins[penguins['Species'] == species]
scatter = px.scatter(df, x='Culmen Length (mm)' , y='Culmen Depth (mm)') # Add the trace to the subplot fig.add_trace(scatter.data[0] , row=row_num, col=1) row_num +=1

Biểu đồ con chim cánh cụt xếp chồng

Nhập môn Trực quan hóa Dữ liệu với Plotly trong Python

Biểu đồ con dùng chung trục


  • Chia sẻ trục x:
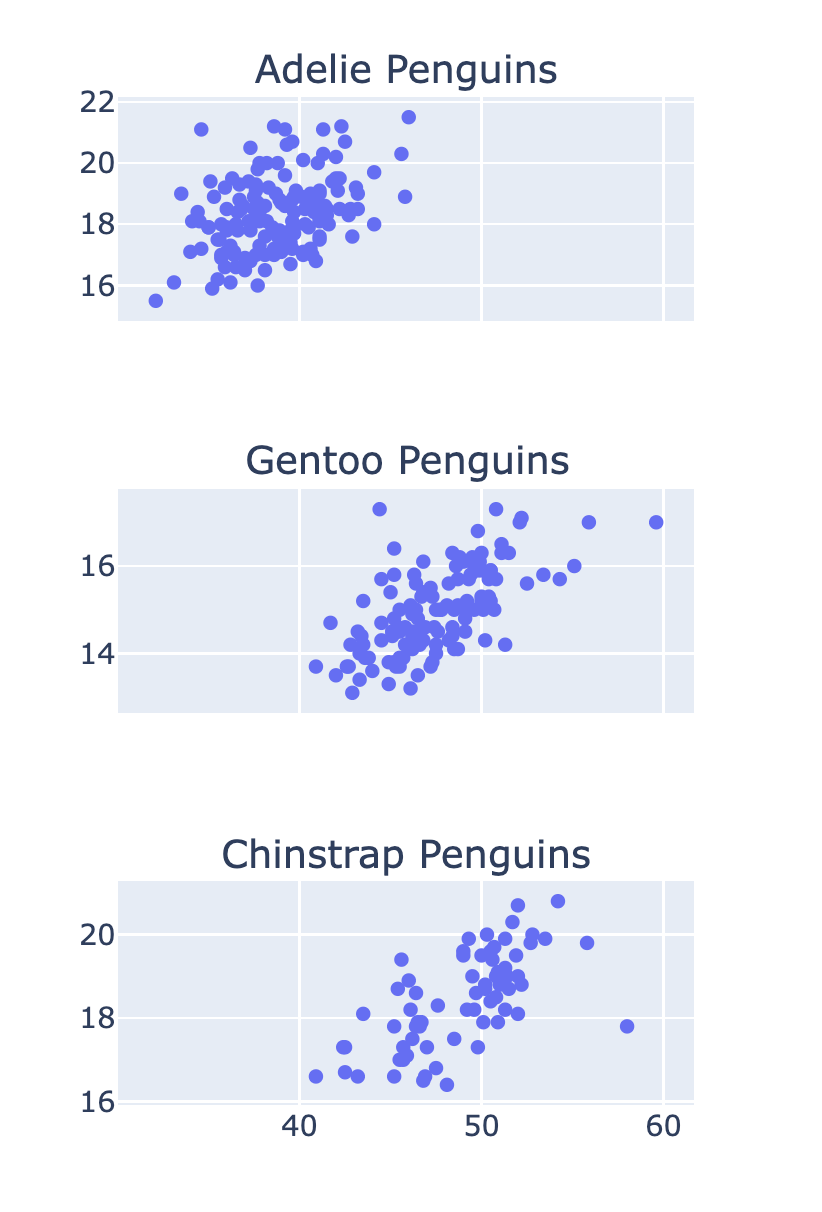
fig = make_subplots(
    rows=3, cols=1
    , shared_xaxes=True)

biểu đồ con chim cánh cụt dùng chung trục x

Nhập môn Trực quan hóa Dữ liệu với Plotly trong Python

Ayo berlatih!

Nhập môn Trực quan hóa Dữ liệu với Plotly trong Python

Preparing Video For Download...