Nhập môn Trực quan hóa Dữ liệu với Plotly trong Python
Alex Scriven
Data Scientist
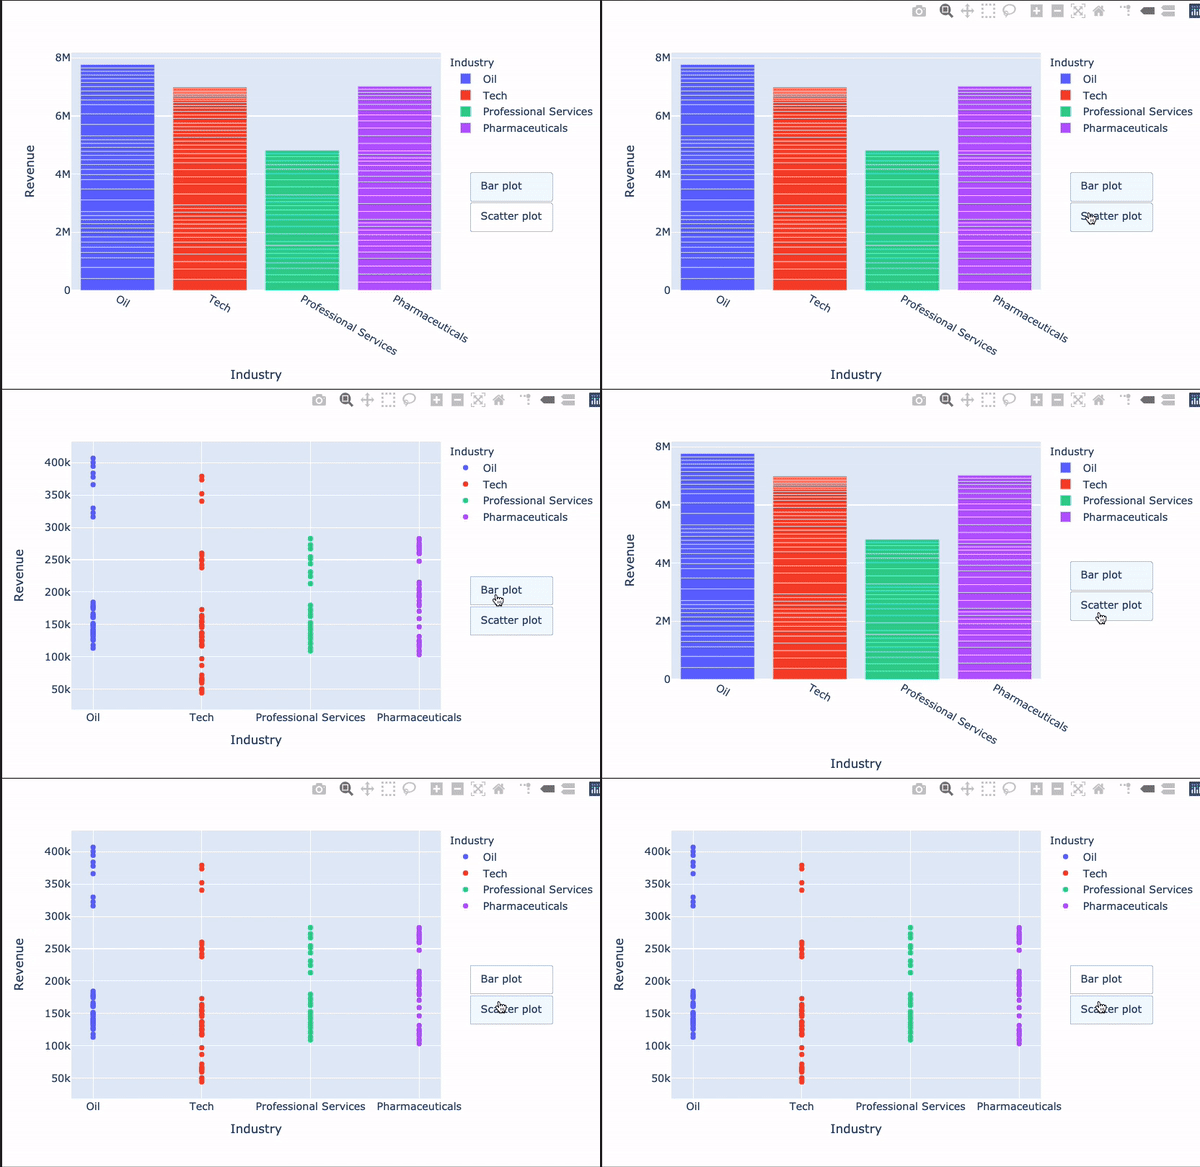
Nút tùy chỉnh có thể:
Cập nhật phần data hoặc layout của biểu đồ
update_layout() đều có thể đưa vào nút!Hỗ trợ hoạt ảnh (ngoài phạm vi khóa học)
Thêm qua đối số updatemenus với các tham số:
type: buttons hoặc dropdowndirection: Hướng sắp xếp nútleft) hoặc xếp dọc (down)x/y: Số thực đặt vị trí nútshowactive: True/False để hiển thị active (chỉ số nút) là đang bấm hay không.buttons: Danh sách đối tượng button$$
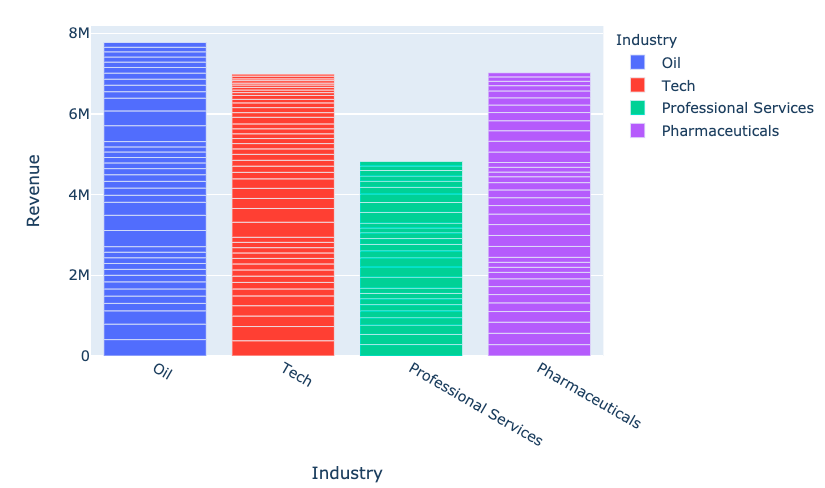
fig = px.bar(
data_frame=revenues,
x='Industry', y='Revenue',
color='Industry')
fig.show()

my_buttons = [{'label': "Bar plot",'method': "update",'args': [{"type": "bar"}]},{'label': "scatterplot",'method': "update",'args': [{"type": "scatter", 'mode': 'markers'}]}]
Một trong những phần gây rối nhất của Plotly!
[{dictionary gửi đến data}, {dictionary gửi đến layout}]

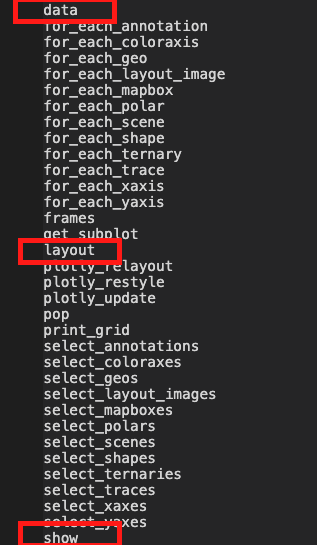
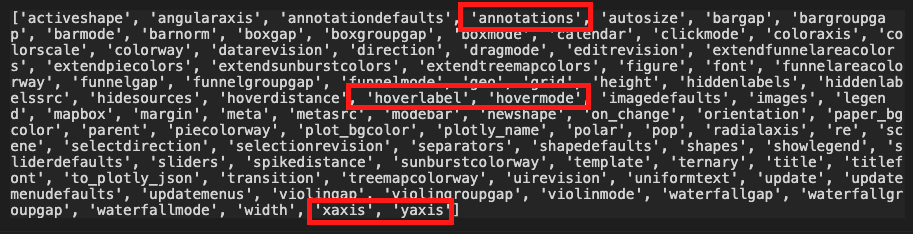
dir(fig.layout)

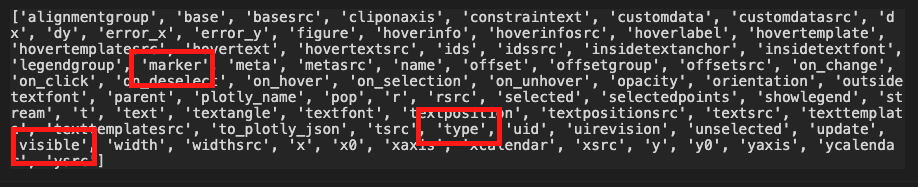
'args'dir(fig.data[0])

$$
fig.update_layout({ 'updatemenus': [{'type': "buttons",'direction': 'down', 'x': 1.3, 'y': 0.5,'showactive': True, 'active': 0,'buttons': my_buttons}] }) fig.show()
$$

Nhập môn Trực quan hóa Dữ liệu với Plotly trong Python