Nhập môn Trực quan hóa Dữ liệu với Plotly trong Python
Alex Scriven
Data Scientist
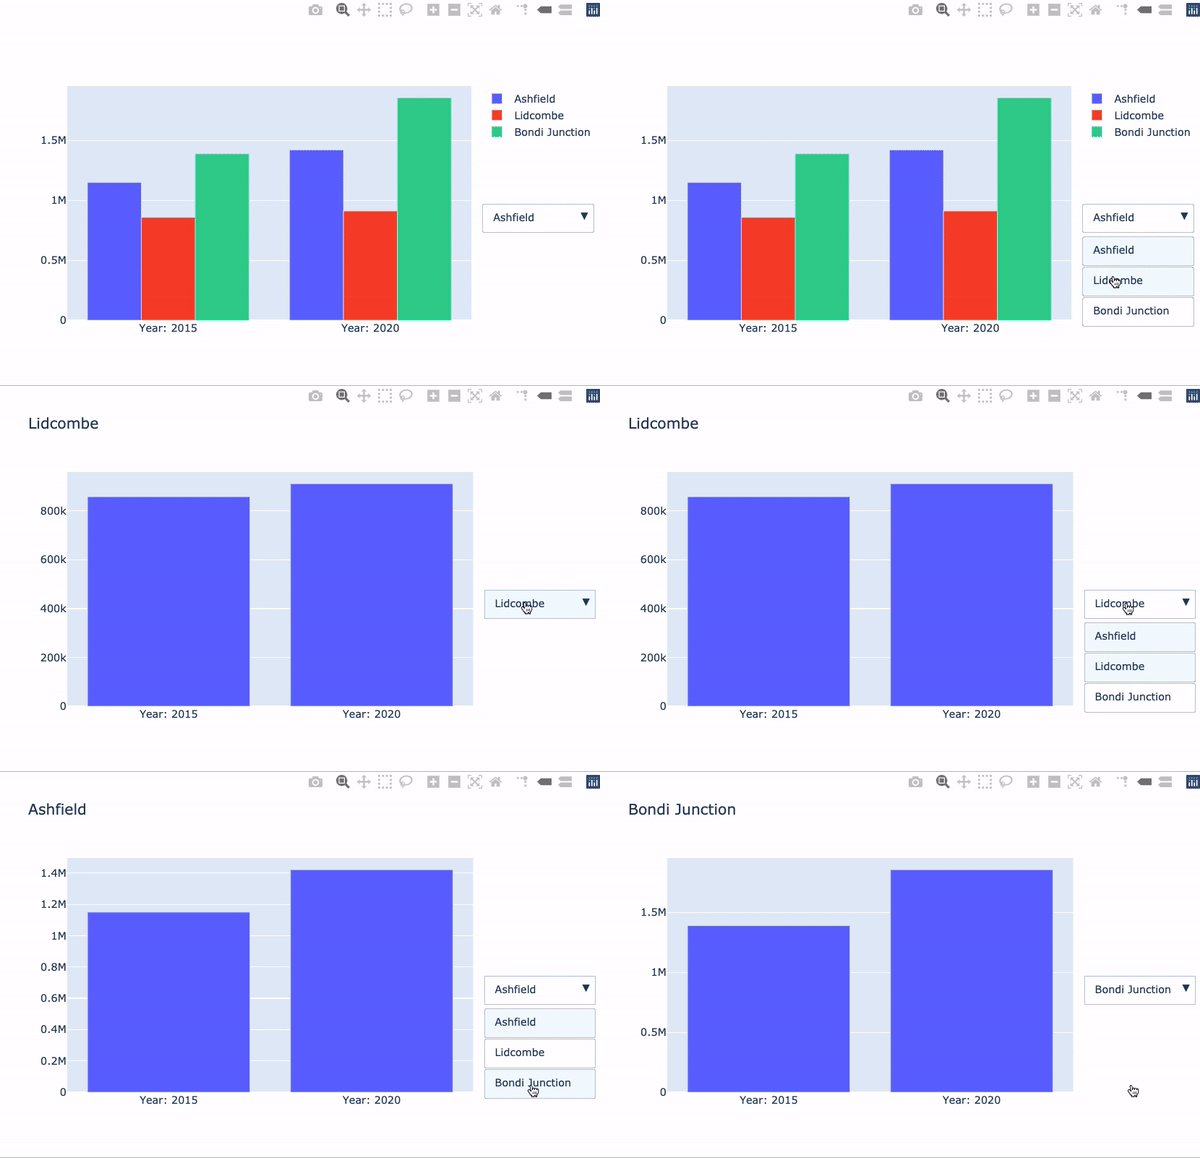
Cho phép người dùng chọn trong một nhóm tùy chọn
Cập nhật dữ liệu hoặc phần tử bố cục
$$
fig = go.Figure()

for suburb in ['Ashfield', 'Lidcombe', 'Bondi Junction']:
    df = syd_houses[syd_houses.Suburb == suburb]

    fig.add_trace(
    px.bar(df, x='Year', y='Median House Price').data[0])
fig = go.Figure()
for suburb in ['Ashfield', 'Lidcombe', 'Bondi Junction']: df = syd_houses[syd_houses.Suburb == suburb]
fig.add_trace( px.bar(df, x='Year', y='Median House Price').data[0])
visible
True
False
args
args:[{'visible': [True, False, False]}]
# Tạo menu thả xuống
dropdown_buttons = [
  {'label': 'Ashfield', 'method': 'update',

   'args': [{'visible': [True, False, False]},
           {'title': 'Ashfield'}]},

  {'label': 'Lidcombe', 'method': 'update',

  'args': [{'visible': [False, True, False]},
          {'title': 'Lidcombe'}]},

  {'label': 'Bondi Junction', 'method': 'update',

  'args': [{'visible': [False, False, True]},
          {'title': 'Bondi Junction'}]}

]
# Tạo menu thả xuống dropdown_buttons = [ {'label': 'Ashfield', 'method': 'update',
'args': [{'visible': [True, False, False]}, {'title': 'Ashfield'}]},
{'label': 'Lidcombe', 'method': 'update',
'args': [{'visible': [False, True, False]}, {'title': 'Lidcombe'}]},
{'label': 'Bondi Junction', 'method': 'update',
'args': [{'visible': [False, False, True]}, {'title': 'Bondi Junction'}]}
]
fig.update_layout({
  'updatemenus':[{
    'type': "dropdown",
    'x': 1.3,
    'y': 0.5,
    'showactive': True,
    'active': 0,
    'buttons': dropdown_buttons}]
})
fig.show()