Choropleth với geopandas

Trực quan hóa dữ liệu không gian địa lý bằng Python

Mary van Valkenburg

Data Science Program Manager, Nashville Software School
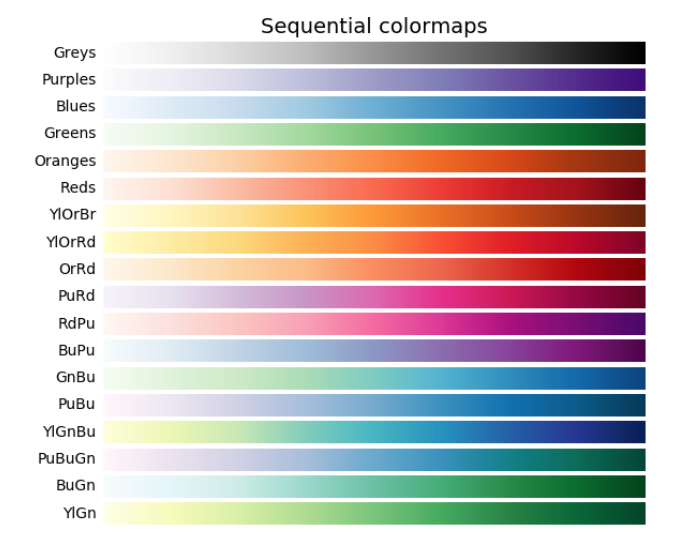
biểu đồ colormap tuần tự

Trực quan hóa dữ liệu không gian địa lý bằng Python

Choropleth với GeoDataFrame.plot()

districts_with_counts.plot(column = 'school_density', legend = True)
plt.title('Số trường trên diện tích độ thập phân bình phương')
plt.xlabel('kinh độ')
plt.ylabel('vĩ độ');
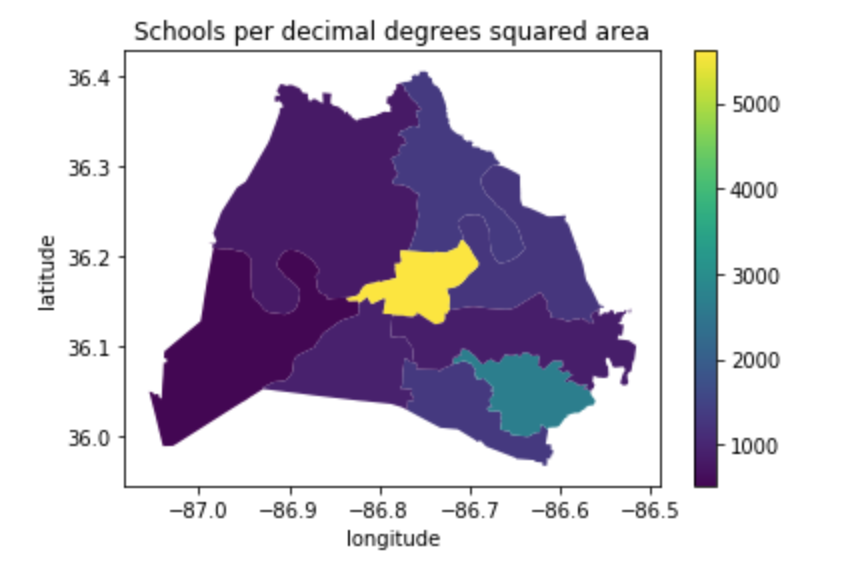
choropleth mật độ trường học dùng colormap viridis

Trực quan hóa dữ liệu không gian địa lý bằng Python

Choropleth với GeoDataFrame.plot()

districts_with_counts.plot(column = 'school_density', cmap = 'BuGn', edgecolor = 'black', legend = True)
plt.title('Số trường trên diện tích độ thập phân bình phương')
plt.xlabel('kinh độ')
plt.ylabel('vĩ độ');
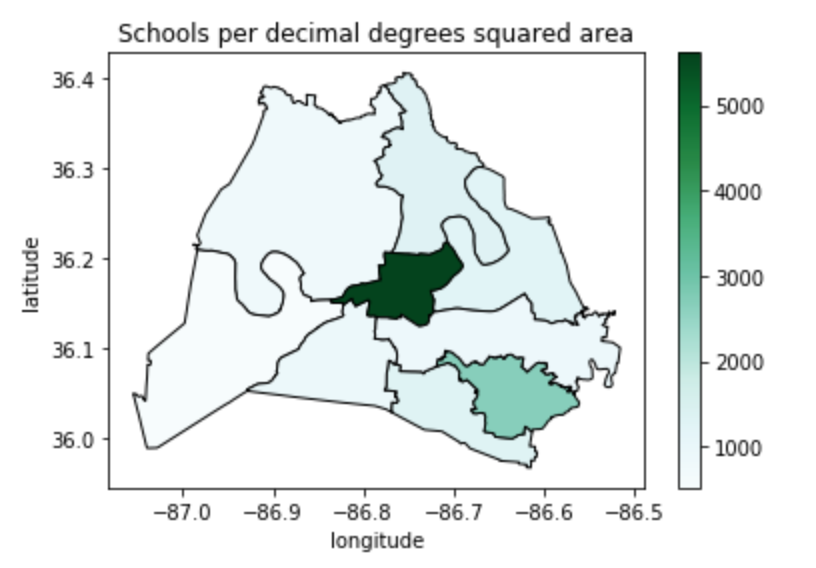
choropleth mật độ trường học với colormap xanh lam–lục

Trực quan hóa dữ liệu không gian địa lý bằng Python

Diện tích theo kilômét vuông

# starting CRS
print(school_districts.crs)
epsg:4326
# convert to EPSG 3857
school_districts = school_districts.to_crs(epsg = 3857)
print(school_districts.crs)
epsg:3857
Trực quan hóa dữ liệu không gian địa lý bằng Python

Diện tích theo kilômét vuông

# define a variable for m^2 to km^2
sqm_to_sqkm = 10**6

school_districts['area'] = school_districts.area / sqm_to_sqkm
school_districts.head(2)
district    geometry                             area
1          (POLYGON ((-965.055 4353528.766...    563.134380
3          (POLYGON ((-965.823 4356392.677...    218.369949
Trực quan hóa dữ liệu không gian địa lý bằng Python
# change crs back to 4326
school_districts = school_districts.to_crs(epsg = 4326)
print(school_districts.crs)
epsg:4326
print(school_districts.head(2))
district      geometry                       area
1             (POLYGON ((-86.771 36.383...   563.134380
3             (POLYGON ((-86.753 36.404...   218.369949
# spatial join to get districts that contain schools
schools_in_districts = gpd.sjoin(school_districts, schools_geo, predicate = 'contains')
Trực quan hóa dữ liệu không gian địa lý bằng Python
# aggregate to get counts
school_counts = schools_in_districts.groupby(['district']).size()
# convert school_counts to a df 
school_counts_df = school_counts.to_frame()
school_counts_df = school_counts_df.reset_index(level=0)
school_counts_df.columns = ['district', 'school_count']
# merge
districts_with_counts = pd.merge(school_districts,
                                 school_counts_df, on = 'district')
districts_with_counts.head(1)
district  geometry                       area       school_count
1         (POLYGON ((-86.771 36.383..    563.134380    30
Trực quan hóa dữ liệu không gian địa lý bằng Python

Tính mật độ trường học

# create school_density
districts_with_counts['school_density'] = districts_with_counts.apply(
    lambda row: row.school_count/row.area, axis = 1)
# plot it
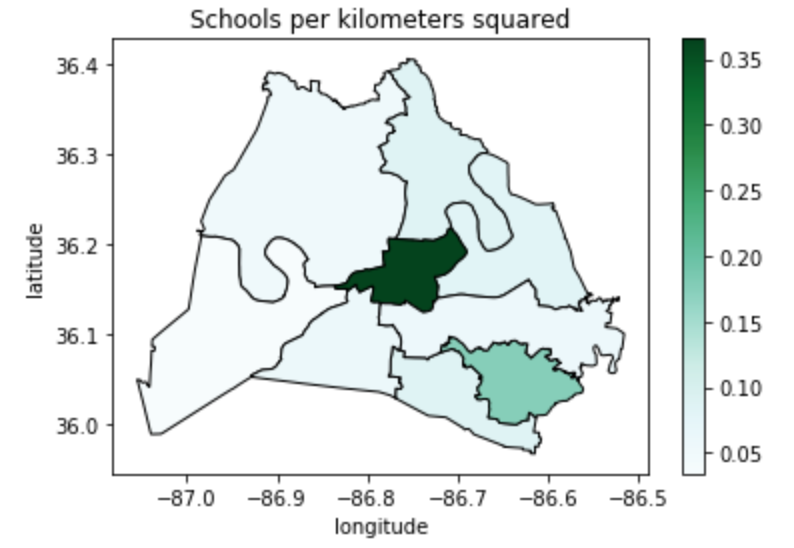
districts_with_counts.plot(column = 'school_density', cmap = 'BuGn', 
                           edgecolor = 'black', legend = True)
plt.title('Số trường trên mỗi kilômét vuông')
plt.xlabel('kinh độ')
plt.ylabel('vĩ độ')
plt.show();
Trực quan hóa dữ liệu không gian địa lý bằng Python

choropleth mật độ trường học trên mỗi kilômét vuông

Trực quan hóa dữ liệu không gian địa lý bằng Python

Cùng luyện tập nào!

Trực quan hóa dữ liệu không gian địa lý bằng Python

Preparing Video For Download...