Trực quan hóa dữ liệu không gian địa lý bằng Python
Mary van Valkenburg
Data Science Program Manager, Nashville Software School
# Construct a map object for Nashville
nashville = [36.1636,-86.7823]
m = folium.Map(location=nashville, zoom_start=10)
# Create a choropleth using the folium Choropleth class
folium.Choropleth(...)
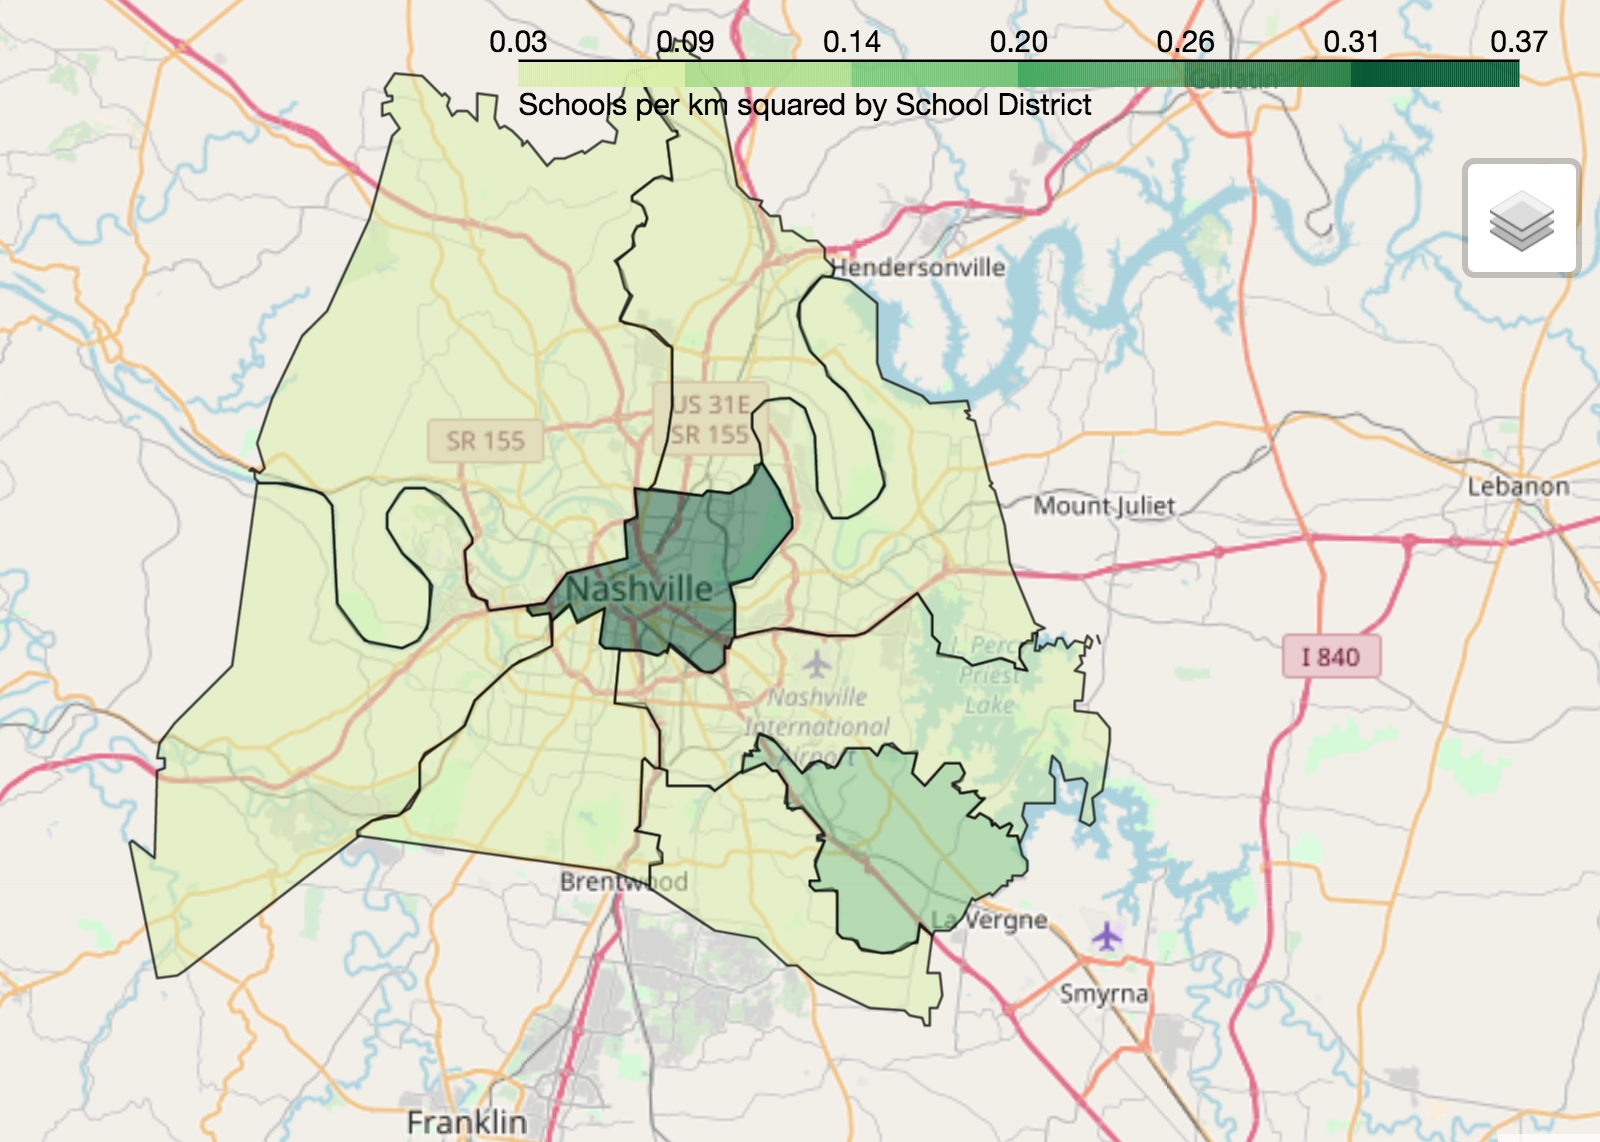
geo_data - dữ liệu nguồn cho các đa giác (tệp geojson hoặc GeoDataFrame)name - tên cột hình học (hoặc thuộc tính geojson) của đa giácdata - DataFrame hoặc Series nguồn cho dữ liệu đã chuẩn hóacolumns - danh sách cột: một cột khớp với đa giác và một cột chứa giá trị cần vẽkey_on - biến GeoJSON để liên kết dữ liệu (luôn bắt đầu bằng feature)fill_color - màu tô đa giác (mặc định là xanh) fill_opacity - khoảng từ 0 (trong suốt) đến 1 (đục hoàn toàn)line_color - màu viền đa giác (mặc định là đen)line_opacity - khoảng từ 0 (trong suốt) đến 1 (đục hoàn toàn) legend_name - tiêu đề cho chú giải# Center point and map for Nashville
nashville = [36.1636,-86.7823]
m = folium.Map(location=nashville, zoom_start=10)
# Define a choropleth layer for the map
folium.Choropleth(
geo_data=districts_with_counts,
name='geometry',
data=districts_with_counts,
columns=['district', 'school_density'],
key_on='feature.properties.district',
fill_color='YlGn',
fill_opacity=0.75,
line_opacity=0.5,
legend_name='Schools per km squared by School District'
).add_to(m)
folium.LayerControl().add_to_map()
display(m)

Trực quan hóa dữ liệu không gian địa lý bằng Python