Vẽ biểu đồ với GeoJSON

Trực quan hóa dữ liệu không gian địa lý bằng Python

Mary van Valkenburg

Data Science Program Manager, Nashville Software School

GeoJSON khu dân cư

{ "type": "FeatureCollection",
  "features": [
    { "type":"Feature",
      "properties":{
    "name":"Historic Buena Vista"
    },"geometry":{
        "type":"MultiPolygon","coordinates":[[[[-86.79511056795417,36.17575....
neighborhoods = gpd.read_file('./data/neighborhood_boundaries.geojson')
neighborhoods.head(1)
        name             geometry
Historic Buena Vista    (POLYGON ((-86.79511056795417 36.17575964963348...)))
Trực quan hóa dữ liệu không gian địa lý bằng Python

Các phụ thuộc của Geopandas

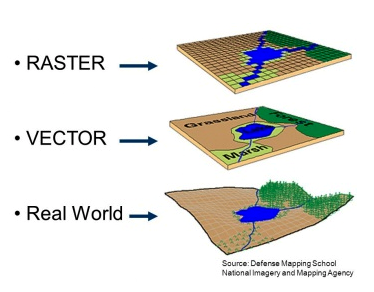
biểu diễn raster và vector

  • Fiona
    • cung cấp API Python cho OGR
  • GDAL/OGR
    • GDAL để chuyển đổi dữ liệu raster
    • OGR để chuyển đổi dữ liệu vector
Trực quan hóa dữ liệu không gian địa lý bằng Python

So sánh đồ họa raster và vector

ảnh raster của Corfu ảnh raster của Corfu
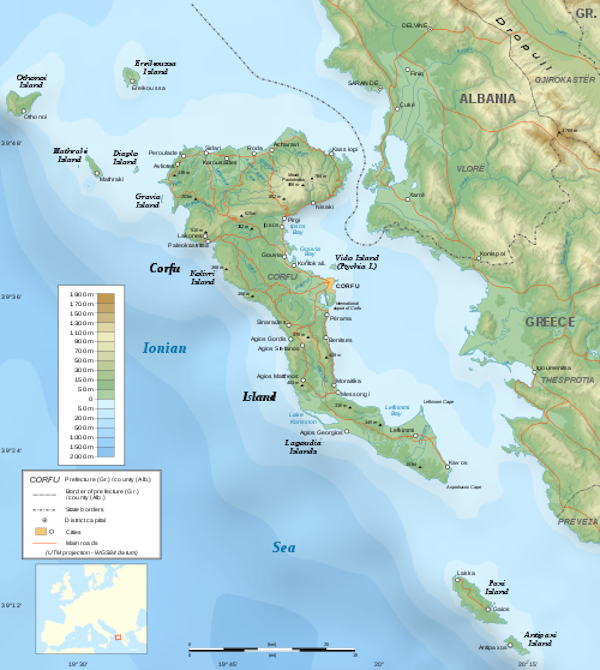
ảnh vector của Corfu ảnh vector của Corfu
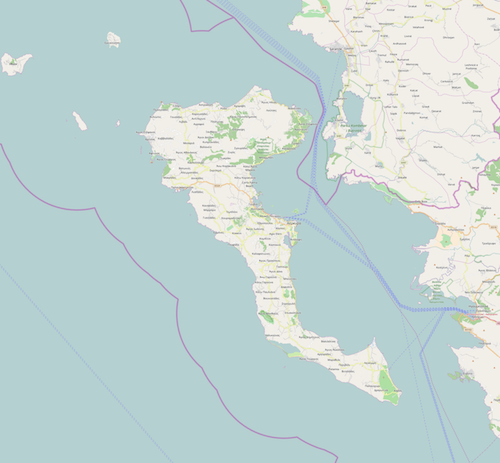
Trực quan hóa dữ liệu không gian địa lý bằng Python

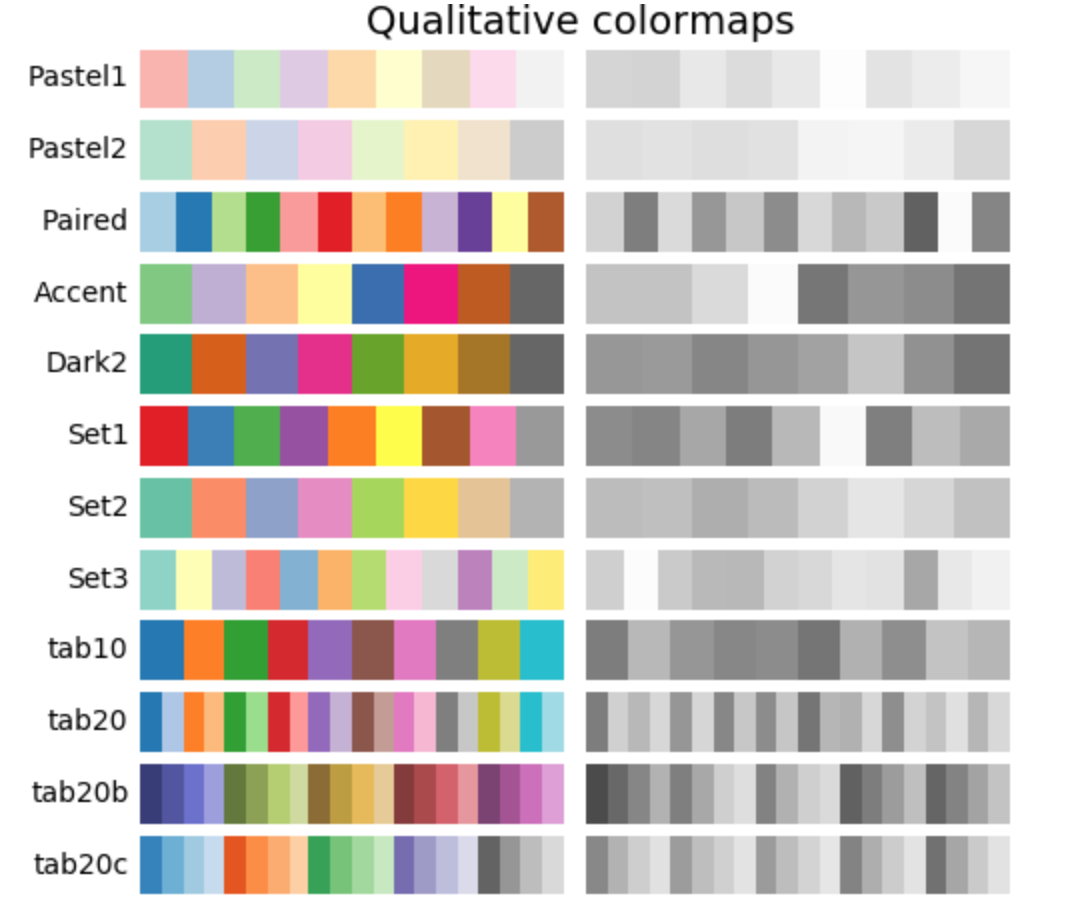
Colormap

Trực quan hóa dữ liệu không gian địa lý bằng Python

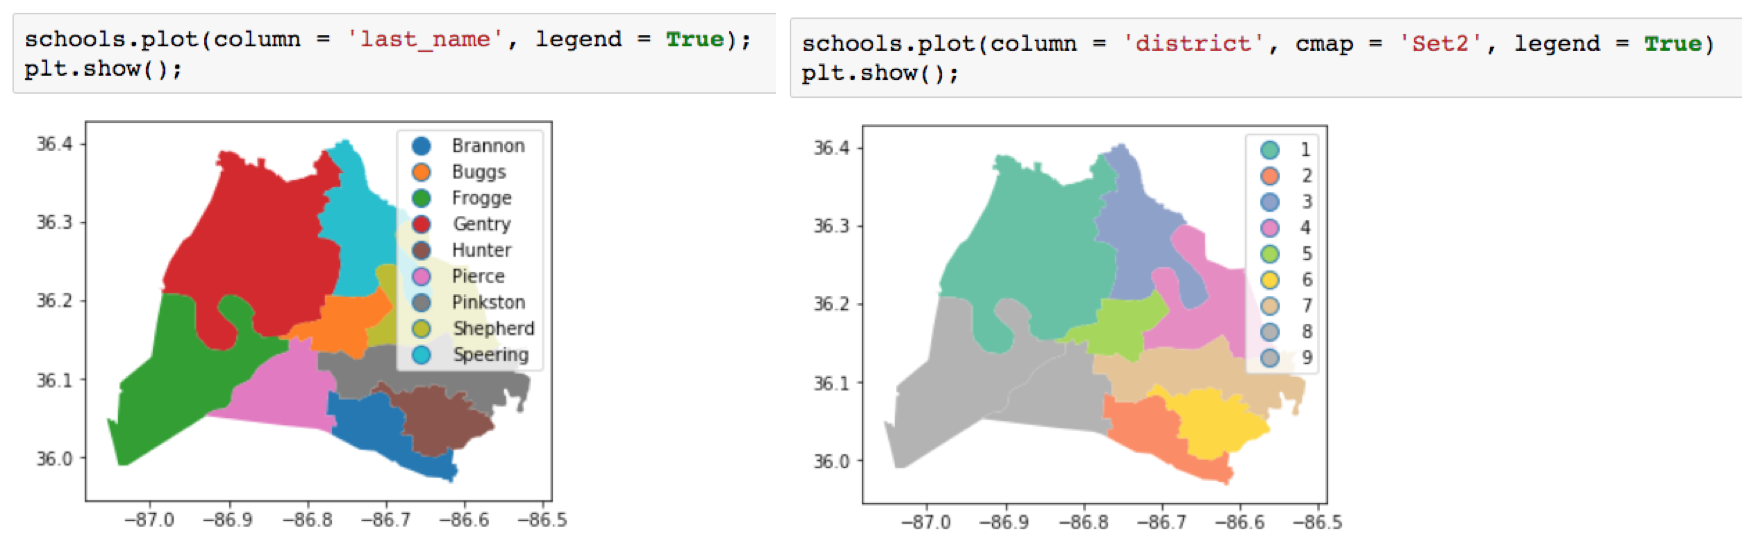
Vẽ với màu sắc

school_districts.head(3)
first_name     last_name    position    district      geometry
Sharon         Gentry       Member       1    (POLYGON ((-86.771 36.383)...))
Jill           Speering     Vice-Chair   3    (POLYGON ((-86.753 36.404)...))
Jo Ann         Brannon      Member       2    (POLYGON ((-86.766 36.083)...))

so sánh colormap

Trực quan hóa dữ liệu không gian địa lý bằng Python
council_dists.plot(
                   column='district', 
                   cmap='Set3', 
                   legend=True)
plt.title('Council Districts')
plt.show();
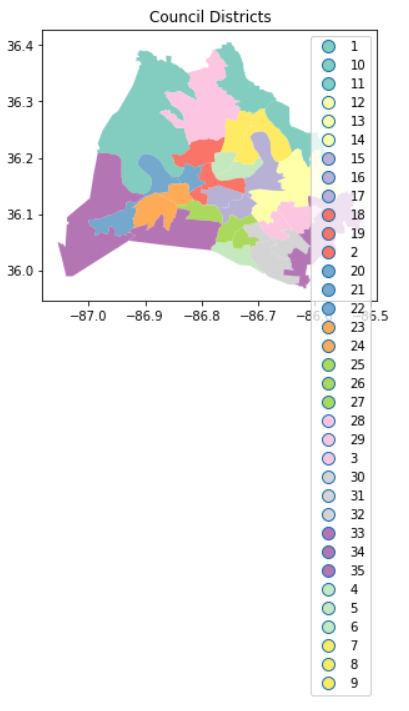
biểu đồ khu vực hội đồng với chú giải dài

leg_kwds={'title':'District Number', 
          'loc': 'upper left', 
          'bbox_to_anchor':(1, 1.03), 
          'ncol':3}
council_dists.plot(column='district', 
                   cmap='Set3',
                   legend=True, 
             legend_kwds=leg_kwds)
plt.title('Council Districts')
plt.show();
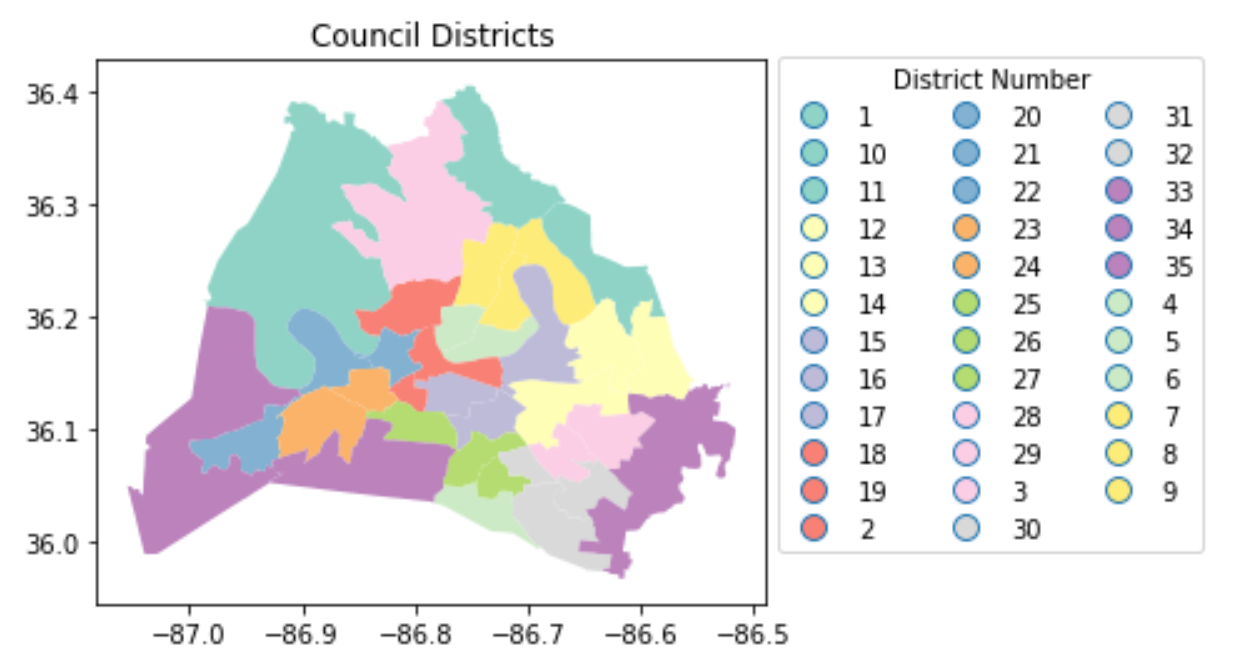
biểu đồ khu vực hội đồng với chú giải nhiều cột

Trực quan hóa dữ liệu không gian địa lý bằng Python

Cùng luyện tập nào!

Trực quan hóa dữ liệu không gian địa lý bằng Python

Preparing Video For Download...