Using FacetGrid, catplot and lmplot
Trực quan hóa dữ liệu nâng cao với Seaborn

Chris Moffitt
Instructor
Tidy data
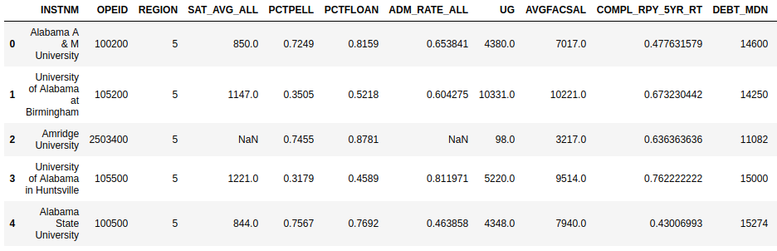
- Seaborn's grid plots require data in "tidy format"
- One observation per row of data
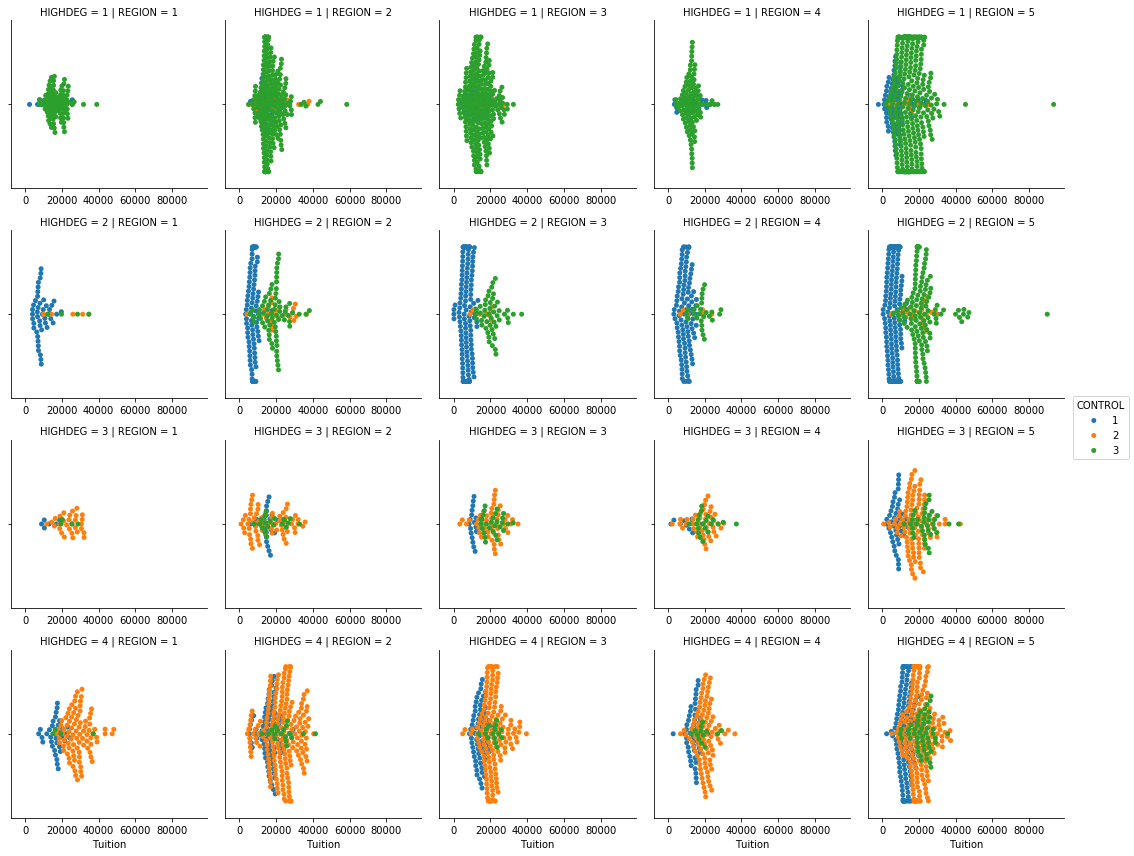
FacetGrid Categorical Example
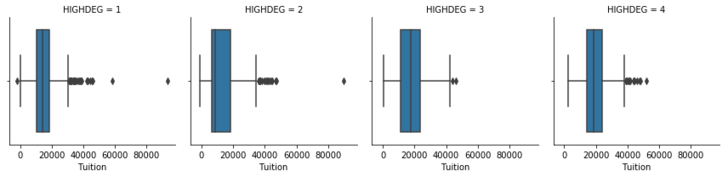
g = sns.FacetGrid(df, col='HIGHDEG')
g.map(sns.boxplot, 'Tuition',
      order=['1', '2', '3', '4'])
catplot()
- The
catplotis a simpler way to use aFacetGridfor categorical data - Combines the facetting and mapping process into 1 function
sns.catplot(x="Tuition", data=df,
            col="HIGHDEG", kind="box")
FacetGrid for regression
FacetGrid()can also be used for scatter or regression plots
g = sns.FacetGrid(df, col='HIGHDEG')
g.map(plt.scatter, 'Tuition', 'SAT_AVG_ALL')

lmplot
lmplotplots scatter and regression plots on aFacetGrid
sns.lmplot(data=df, x="Tuition", y="SAT_AVG_ALL",
           col="HIGHDEG", fit_reg=False)
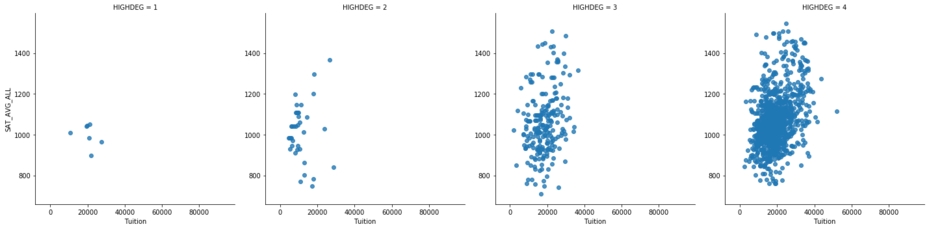
lmplot with regression
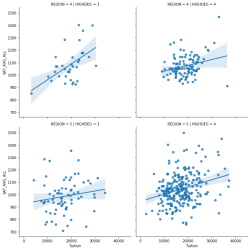
sns.lmplot(data=df, x="Tuition", y="SAT_AVG_ALL",
           col="HIGHDEG", row="REGION")