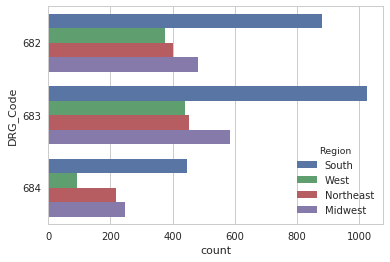
Categorical Plot Types
Trực quan hóa dữ liệu nâng cao với Seaborn

Chris Moffitt
Instructor
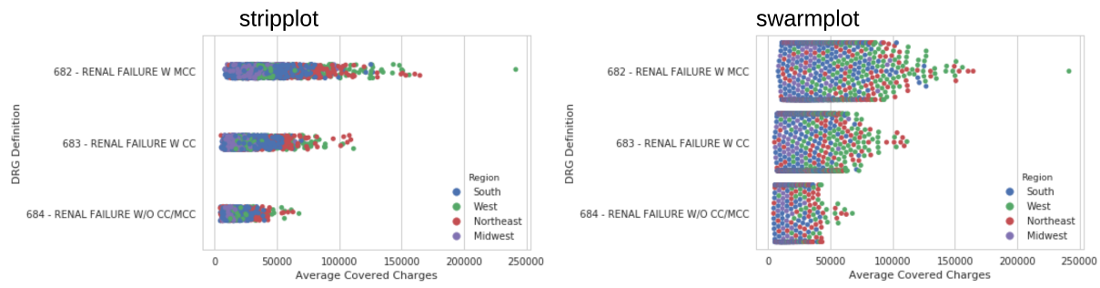
Plot types - show each observation
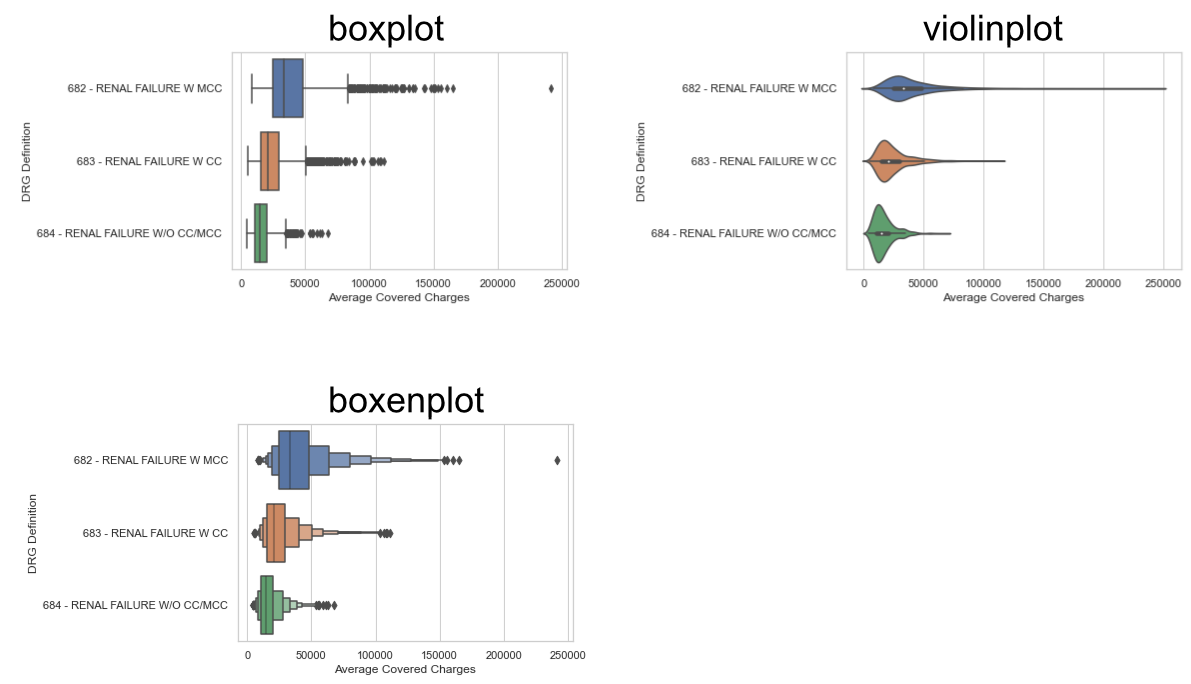
Plot types - abstract representations
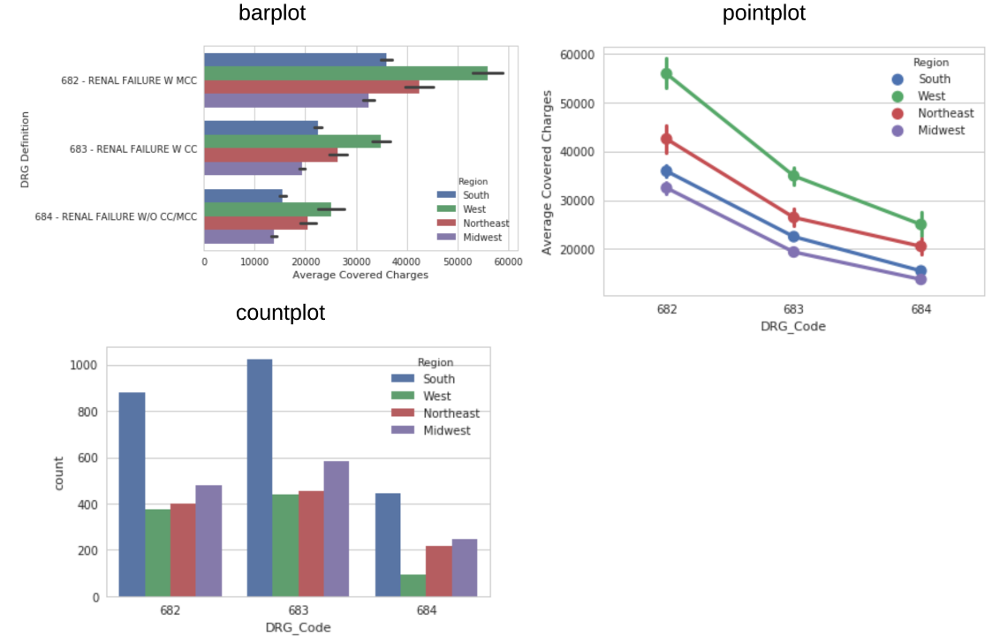
Plot types - statistical estimates
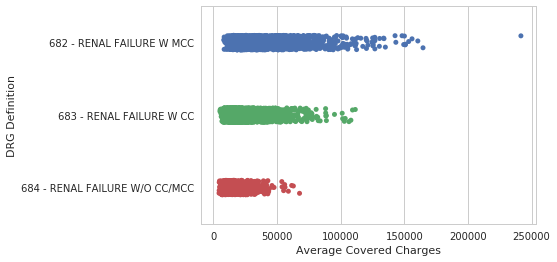
Plots of each observation - stripplot
sns.stripplot(data=df, y="DRG Definition",
              x="Average Covered Charges",
              jitter=True)
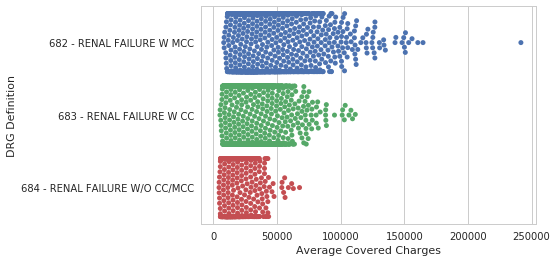
Plots of each observation - swarmplot
sns.swarmplot(data=df, y="DRG Definition",
              x="Average Covered Charges")
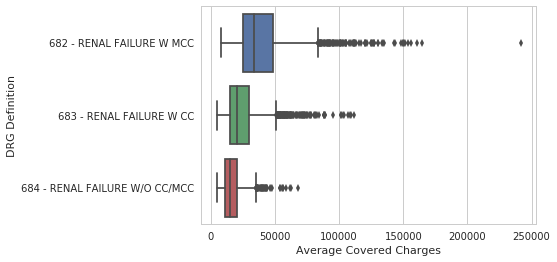
Abstract representations - boxplot
sns.boxplot(data=df, y="DRG Definition",
            x="Average Covered Charges")
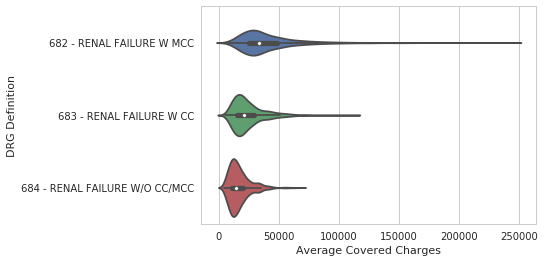
Abstract representation - violinplot
sns.violinplot(data=df, y="DRG Definition",
               x="Average Covered Charges")
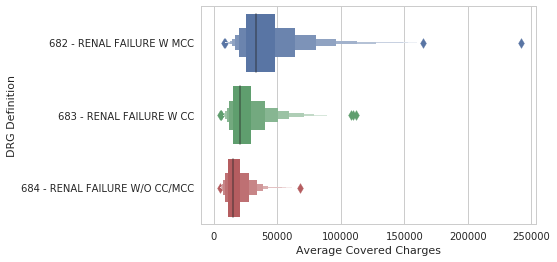
Abstract representation - boxenplot
sns.boxenplot(data=df, y="DRG Definition",
              x="Average Covered Charges")
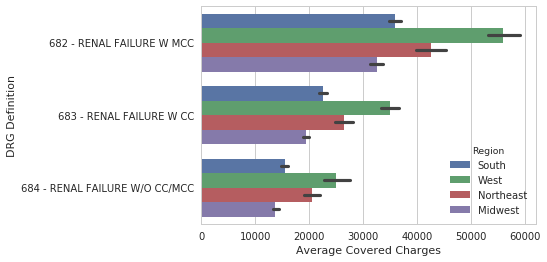
Statistical estimates - barplot
sns.barplot(data=df, y="DRG Definition",
            x="Average Covered Charges",
            hue="Region")
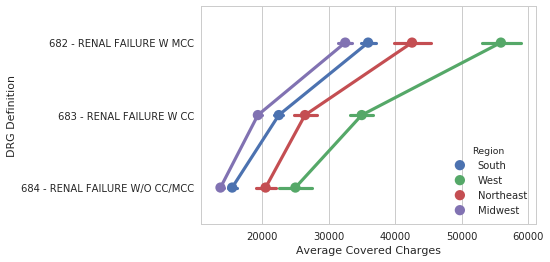
Statistical estimates - pointplot
sns.pointplot(data=df, y="DRG Definition",
              x="Average Covered Charges",
              hue="Region")
Statistical estimates - countplot
sns.countplot(data=df, y="DRG_Code", hue="Region")