Using JointGrid and jointplot

Trực quan hóa dữ liệu nâng cao với Seaborn

Chris Moffitt

Instructor

JointGrid() Overview
JointGrid Overview

Trực quan hóa dữ liệu nâng cao với Seaborn

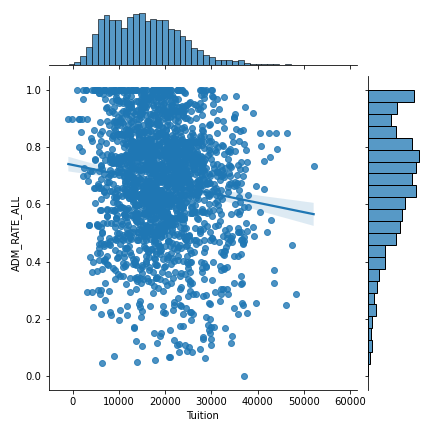
Basic JointGrid

g = sns.JointGrid(data=df, x="Tuition", y="ADM_RATE_ALL") 
g.plot(sns.regplot, sns.histplot)

JointGrid Example

Trực quan hóa dữ liệu nâng cao với Seaborn

Advanced JointGrid

g = sns.JointGrid(data=df, x="Tuition", y="ADM_RATE_ALL") 
g = g.plot_joint(sns.kdeplot)
g = g.plot_marginals(sns.kdeplot, shade=True)

JointGrid example annotated

Trực quan hóa dữ liệu nâng cao với Seaborn

jointplot()

sns.jointplot(data=df, x="Tuition", y="ADM_RATE_ALL", kind='hex')
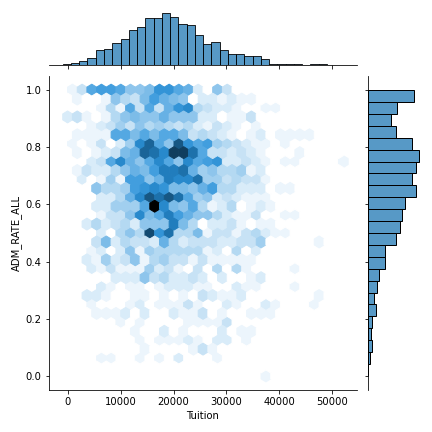
jointplot example

Trực quan hóa dữ liệu nâng cao với Seaborn

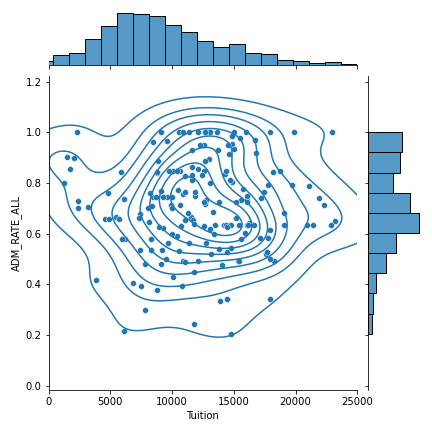
Customizing a jointplot

g = (sns.jointplot(x="Tuition",
                   y="ADM_RATE_ALL",
                   kind="scatter",
                   xlim=(0, 25000),
                   data=df.query('UG < 2500 &
                   Ownership == "Public"'))
    .plot_joint(sns.kdeplot))
Trực quan hóa dữ liệu nâng cao với Seaborn

Customizing a jointplot

jointplot

Trực quan hóa dữ liệu nâng cao với Seaborn

Let's practice!

Trực quan hóa dữ liệu nâng cao với Seaborn

Preparing Video For Download...