EDA ban đầu
Chinh phục cuộc thi Kaggle bằng Python

Yauhen Babakhin
Kaggle Grandmaster
Mục tiêu EDA
- Kích thước dữ liệu
- Thuộc tính của biến đích
- Thuộc tính của đặc trưng
- Nảy ý tưởng cho kỹ thuật đặc trưng
Two Sigma Connect: yêu cầu xem tin cho thuê
Phát biểu bài toán
Dự đoán mức độ phổ biến của tin cho thuê căn hộ
Biến đích
interest_level
Loại bài toán
Phân loại với 3 lớp: 'high', 'medium' và 'low'
Thước đo
Độ mất mát log đa lớp
EDA. Phần I
# Kích thước dữ liệu
twosigma_train = pd.read_csv('twosigma_train.csv')
print('Train shape:', twosigma_train.shape)

twosigma_test = pd.read_csv('twosigma_test.csv')
print('Test shape:', twosigma_test.shape)
Train shape: (49352, 11)
Test shape: (74659, 10)
EDA. Phần I
print(twosigma_train.columns.tolist())
['id', 'bathrooms', 'bedrooms', 'building_id', 'latitude', 'longitude',
'manager_id', 'price', 'interest_level']
twosigma_train.interest_level.value_counts()
low       34284
medium    11229
high       3839
EDA. Phần I
# Mô tả dữ liệu huấn luyện
twosigma_train.describe()
         bathrooms      bedrooms      latitude     longitude         price
count  49352.00000  49352.000000  49352.000000  49352.000000  4.935200e+04
mean       1.21218      1.541640     40.741545    -73.955716  3.830174e+03
std        0.50142      1.115018      0.638535      1.177912  2.206687e+04
min        0.00000      0.000000      0.000000   -118.271000  4.300000e+01
25%        1.00000      1.000000     40.728300    -73.991700  2.500000e+03
50%        1.00000      1.000000     40.751800    -73.977900  3.150000e+03
75%        1.00000      2.000000     40.774300    -73.954800  4.100000e+03
max       10.00000      8.000000     44.883500      0.000000  4.490000e+06
EDA. Phần II
import matplotlib.pyplot as plt
plt.style.use('ggplot')
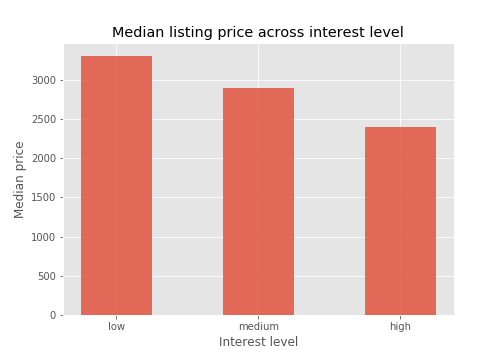
# Tìm giá trung vị theo mức quan tâm
prices = twosigma_train.groupby('interest_level', as_index=False)['price'].median()
EDA. Phần II
# Vẽ biểu đồ cột fig = plt.figure(figsize=(7, 5)) plt.bar(prices.interest_level, prices.price, width=0.5, alpha=0.8)# Đặt tiêu đề plt.xlabel('Mức quan tâm') plt.ylabel('Giá trung vị') plt.title('Giá niêm yết trung vị theo mức quan tâm')# Hiển thị biểu đồ plt.show()
Ayo berlatih!
Chinh phục cuộc thi Kaggle bằng Python

