Vẽ hồi quy Poisson

Generalized Linear Models in R

Richard Erickson

Instructor

Khi nào dùng geom_smooth với Poisson

  • Phù hợp nhất với biến dự báo liên tục
  • Ví dụ: liều tăng và số tế bào ung thư trên cm$^2$
  • Nếu không, dùng boxplot hoặc công cụ vẽ tương tự
Generalized Linear Models in R

Nghiên cứu liều với tế bào ung thư

  • Mô phỏng dữ liệu
  • Đáp ứng theo liều
    • x: Liều
    • y: Số tế bào ung thư trên cm$^2$
Generalized Linear Models in R

Vẽ điểm

ggplot(data = dat, aes(x = dose, y = cells)) +
    geom_point()
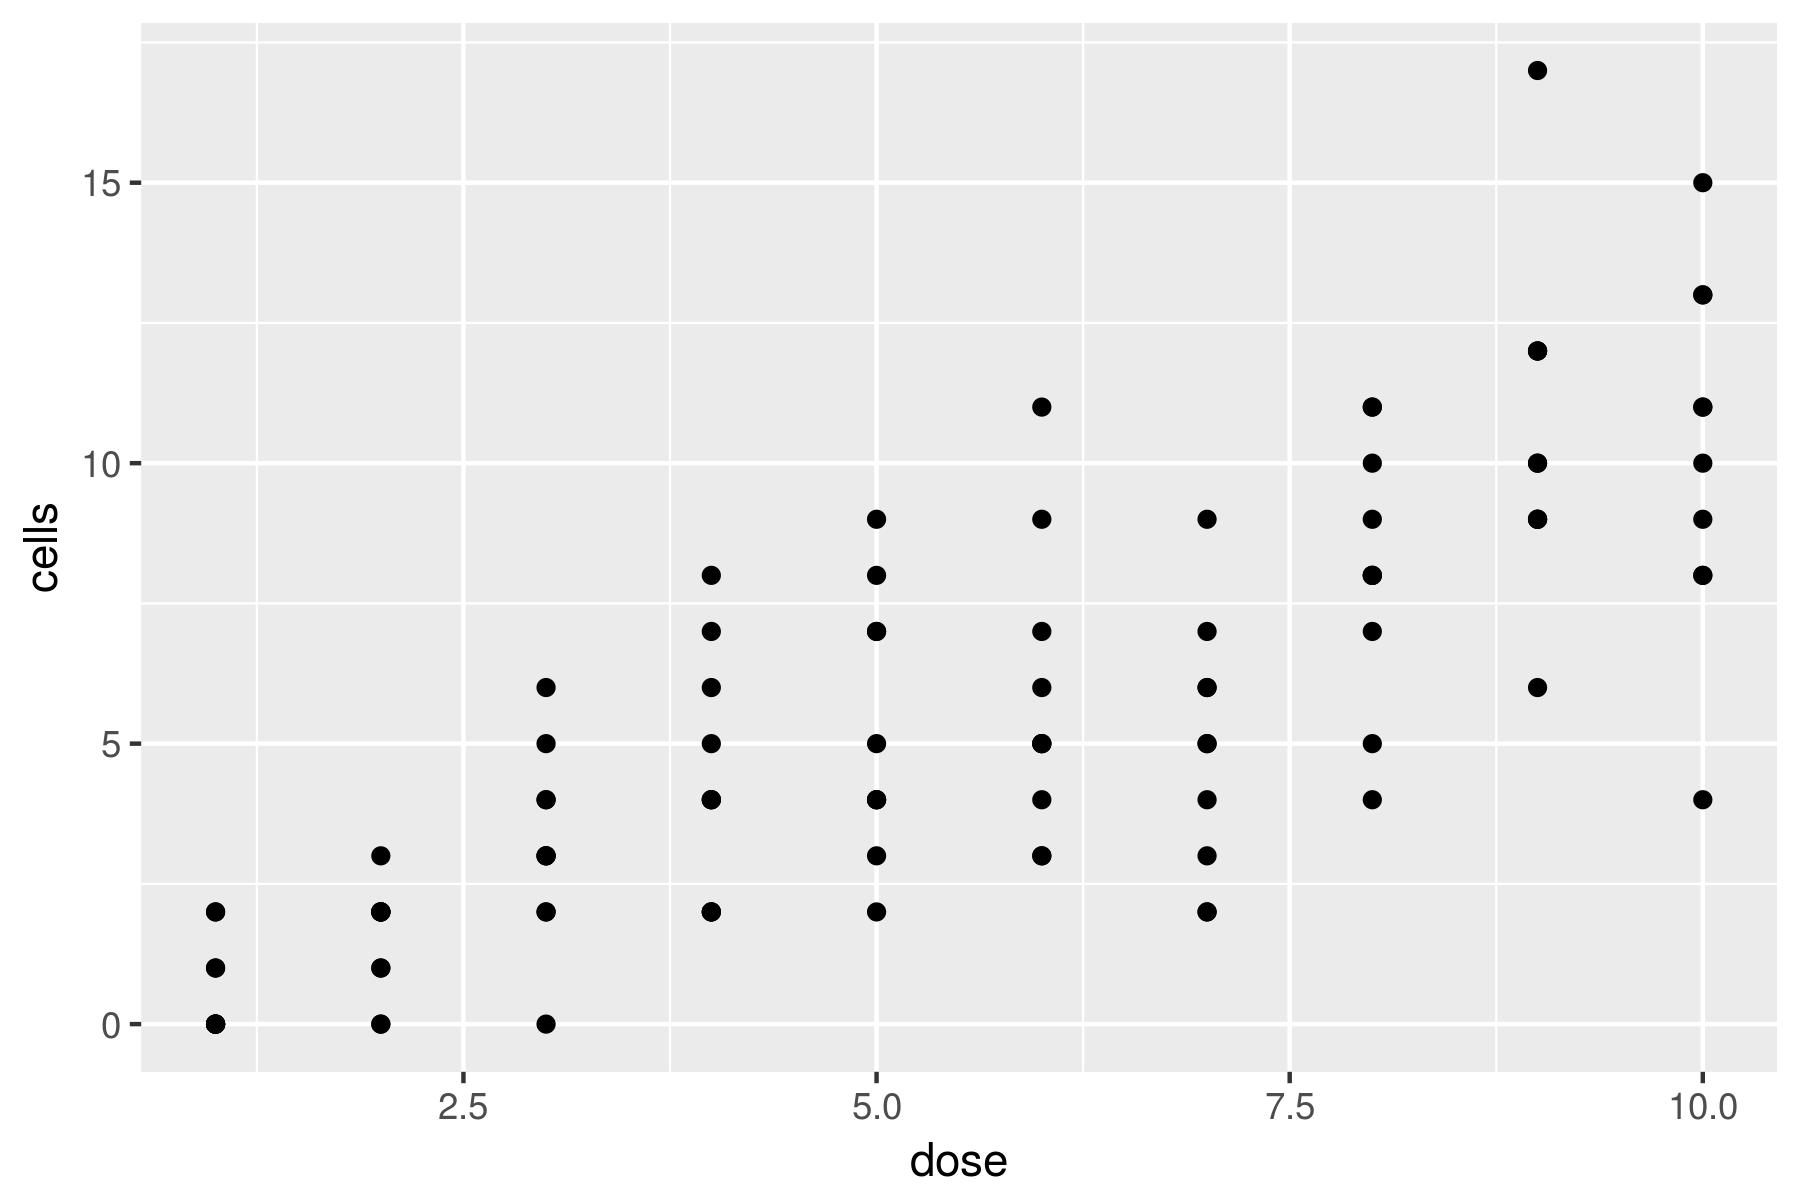
ggplot với các điểm

Generalized Linear Models in R

Jitter các điểm

ggplot(data = dat, aes(x = dose, y = cells)) +
   geom_jitter(width = 0.05, height = 0.05)
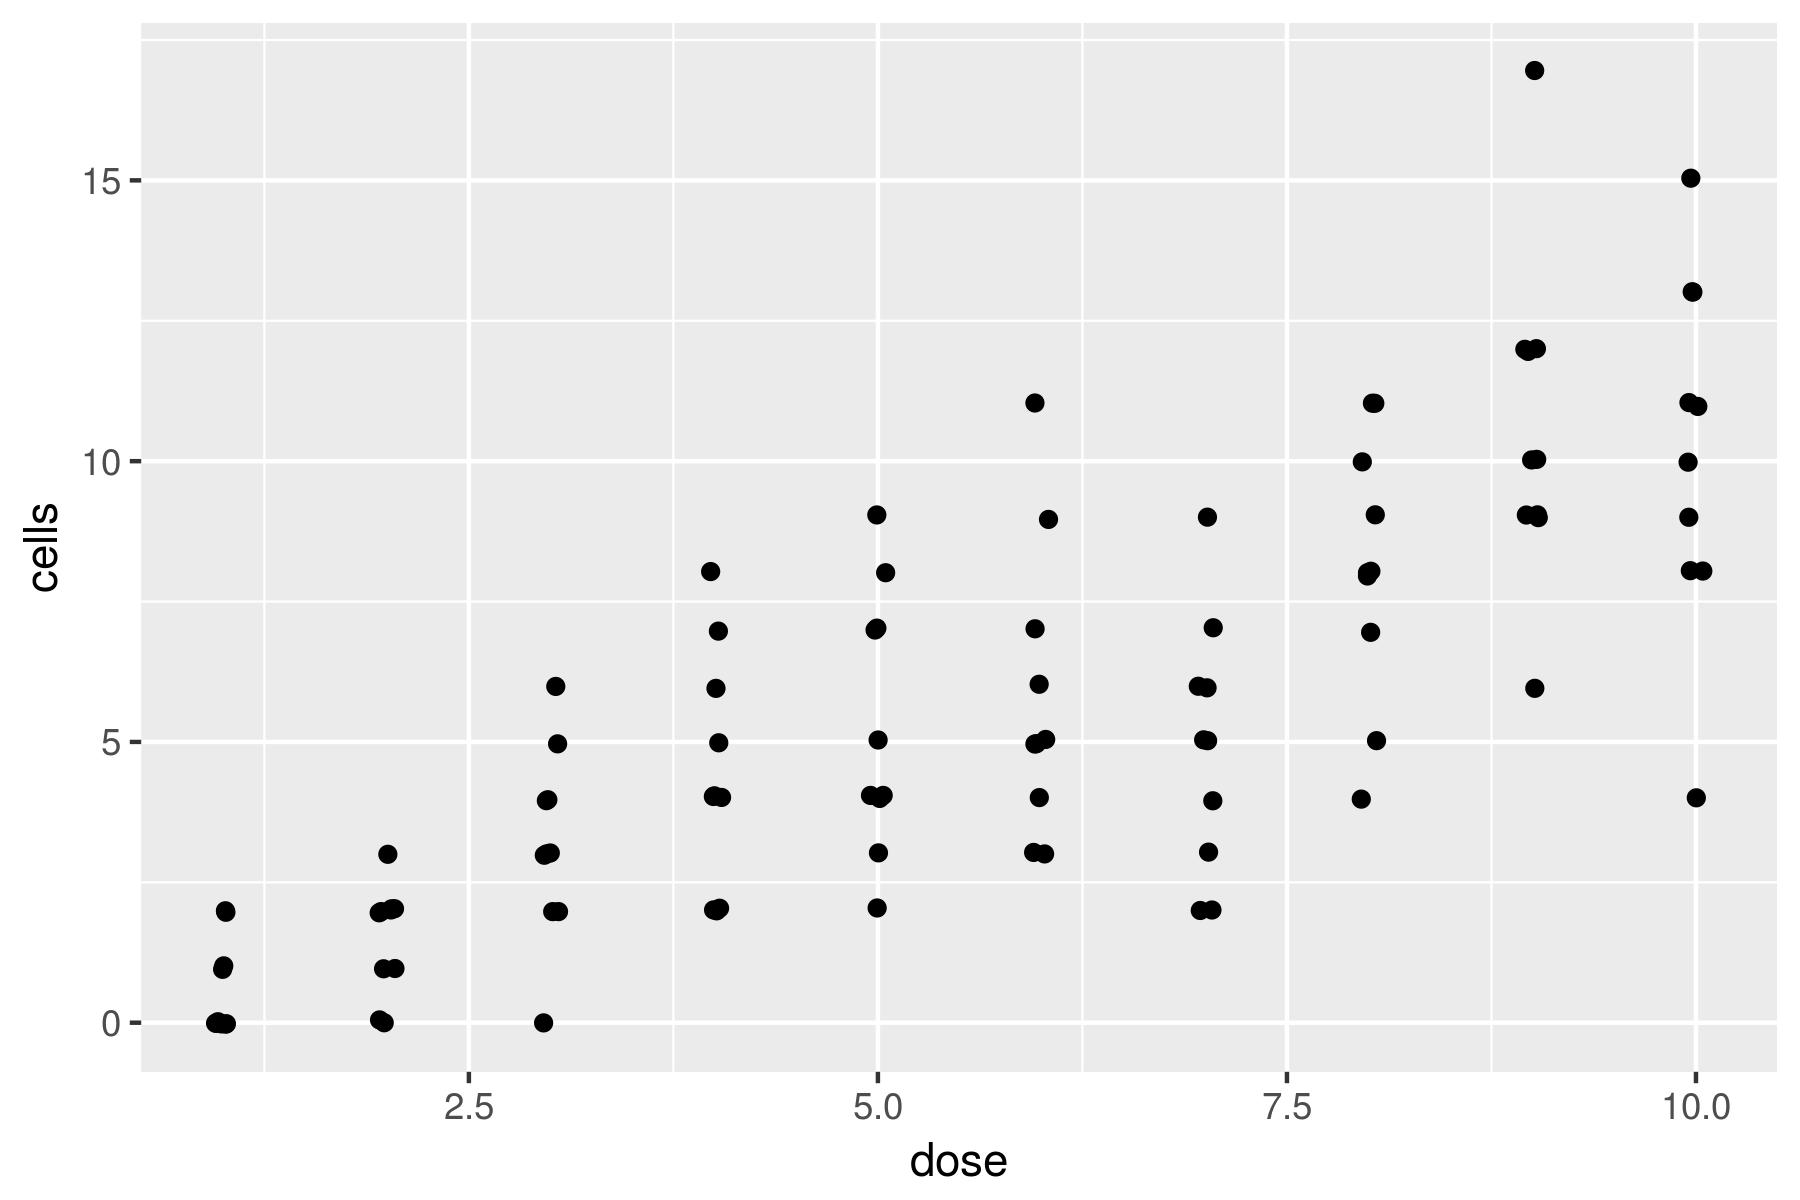
Ví dụ điểm jitter trong ggplot2.

Generalized Linear Models in R

geom_smooth()

ggplot(data = dat, aes(x = dose, y = cells)) +
   geom_jitter(width = 0.05, height = 0.05)
   geom_smooth()
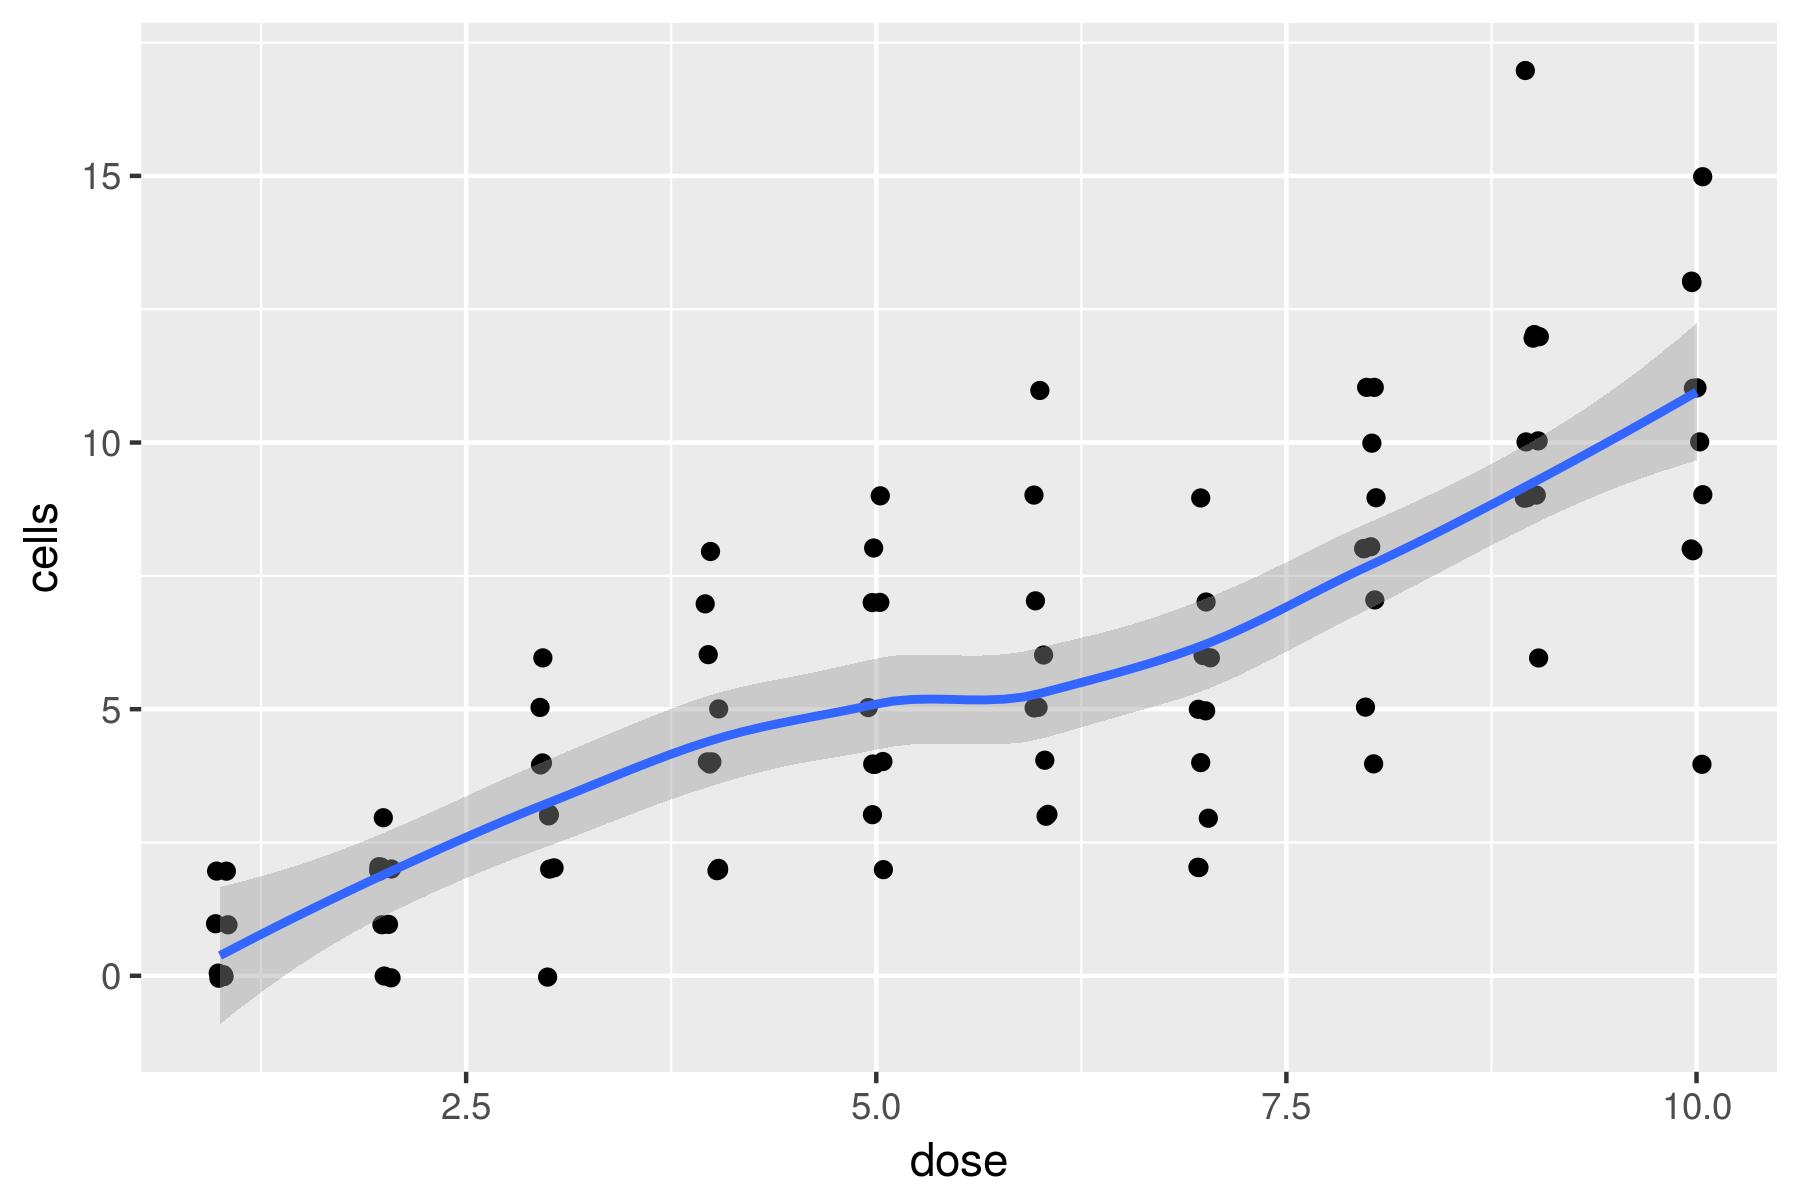
Ví dụ geom_smooth() mặc định trên các điểm jitter

Generalized Linear Models in R

GLM với geom_smooth()

ggplot(data = dat, aes(x = dose, y = cells)) +
   geom_jitter(width = 0.05, height = 0.05)
   geom_smooth(method = 'glm')
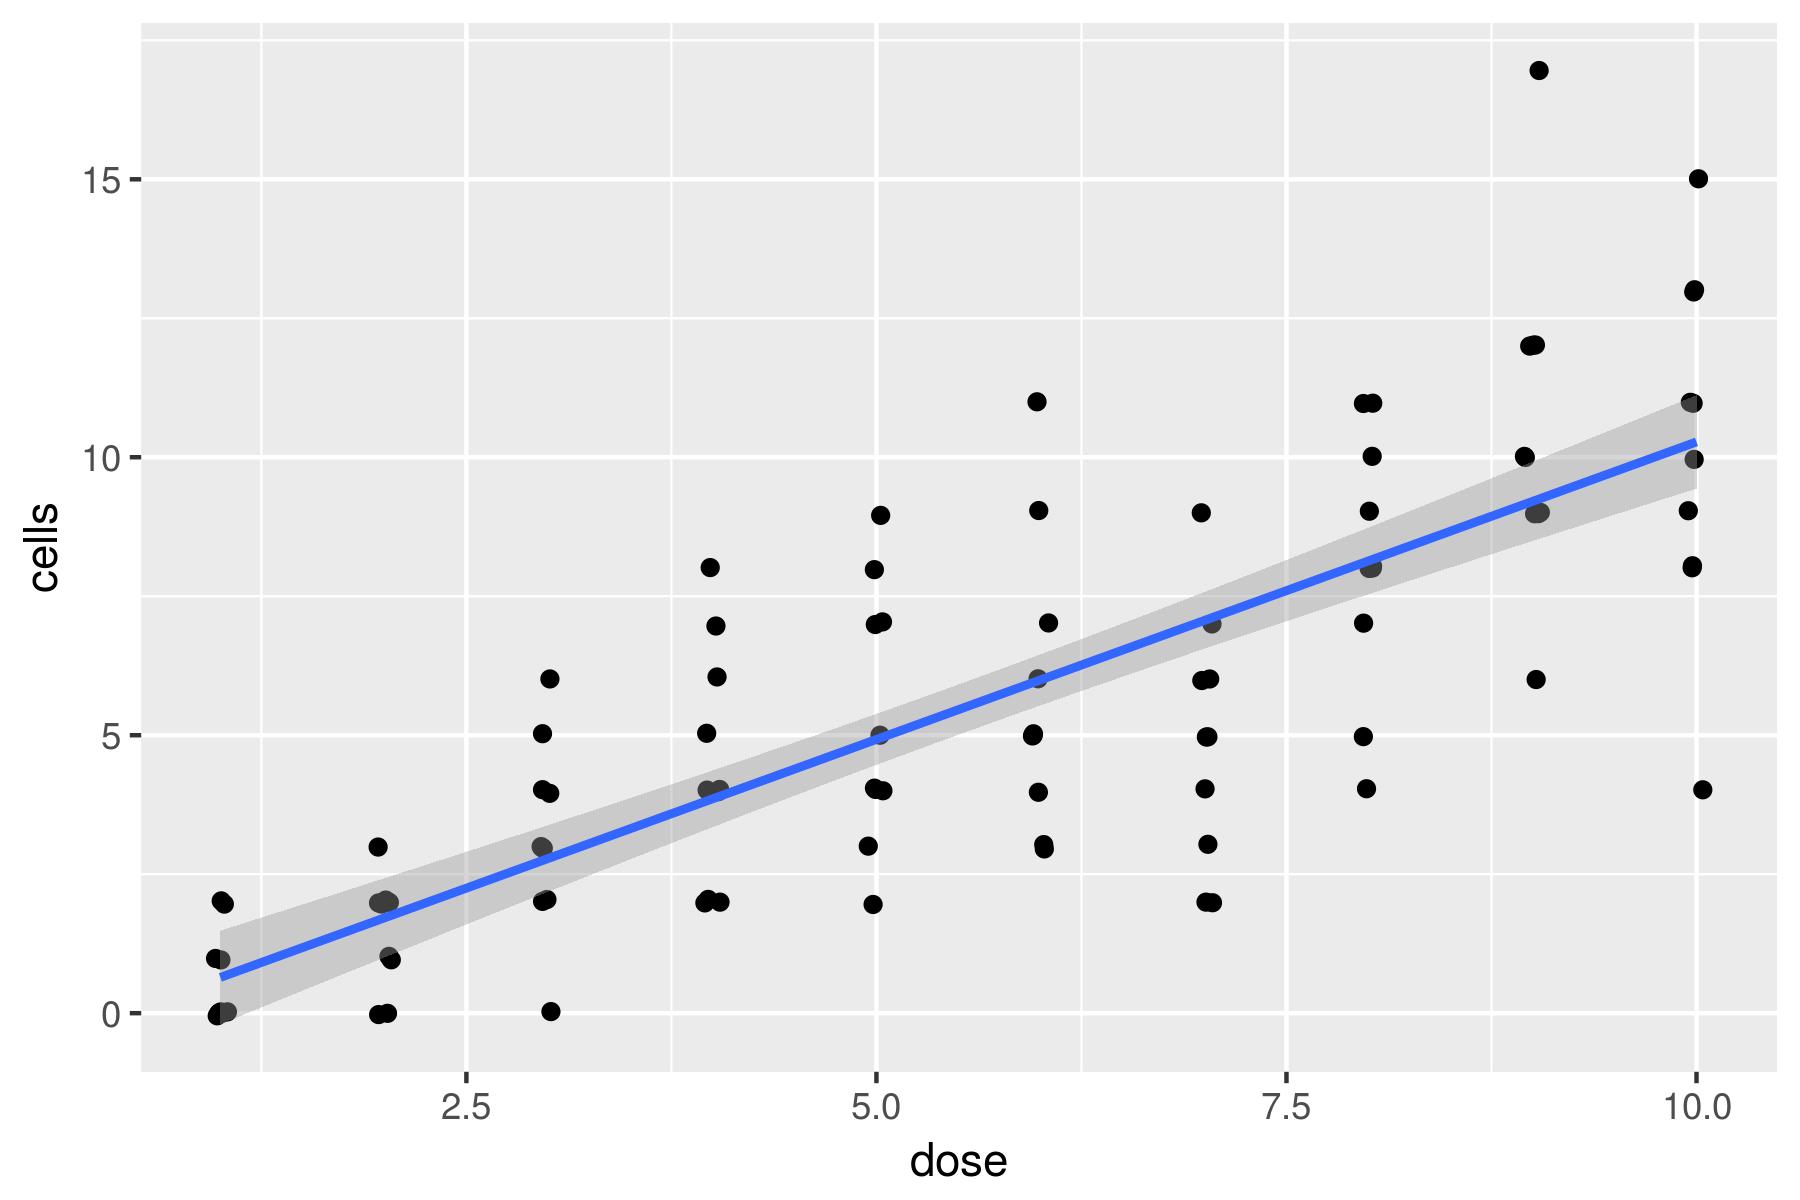
Ví dụ GLM với geom_smooth() và GLM mặc định, là LM

Generalized Linear Models in R

GLM Poisson với geom_smooth()

ggplot(data = dat, aes(x = dose, y = cells)) +
   geom_jitter(width = 0.05, height = 0.05) +
   geom_smooth(method = 'glm', method.args = list(family = 'poisson'))
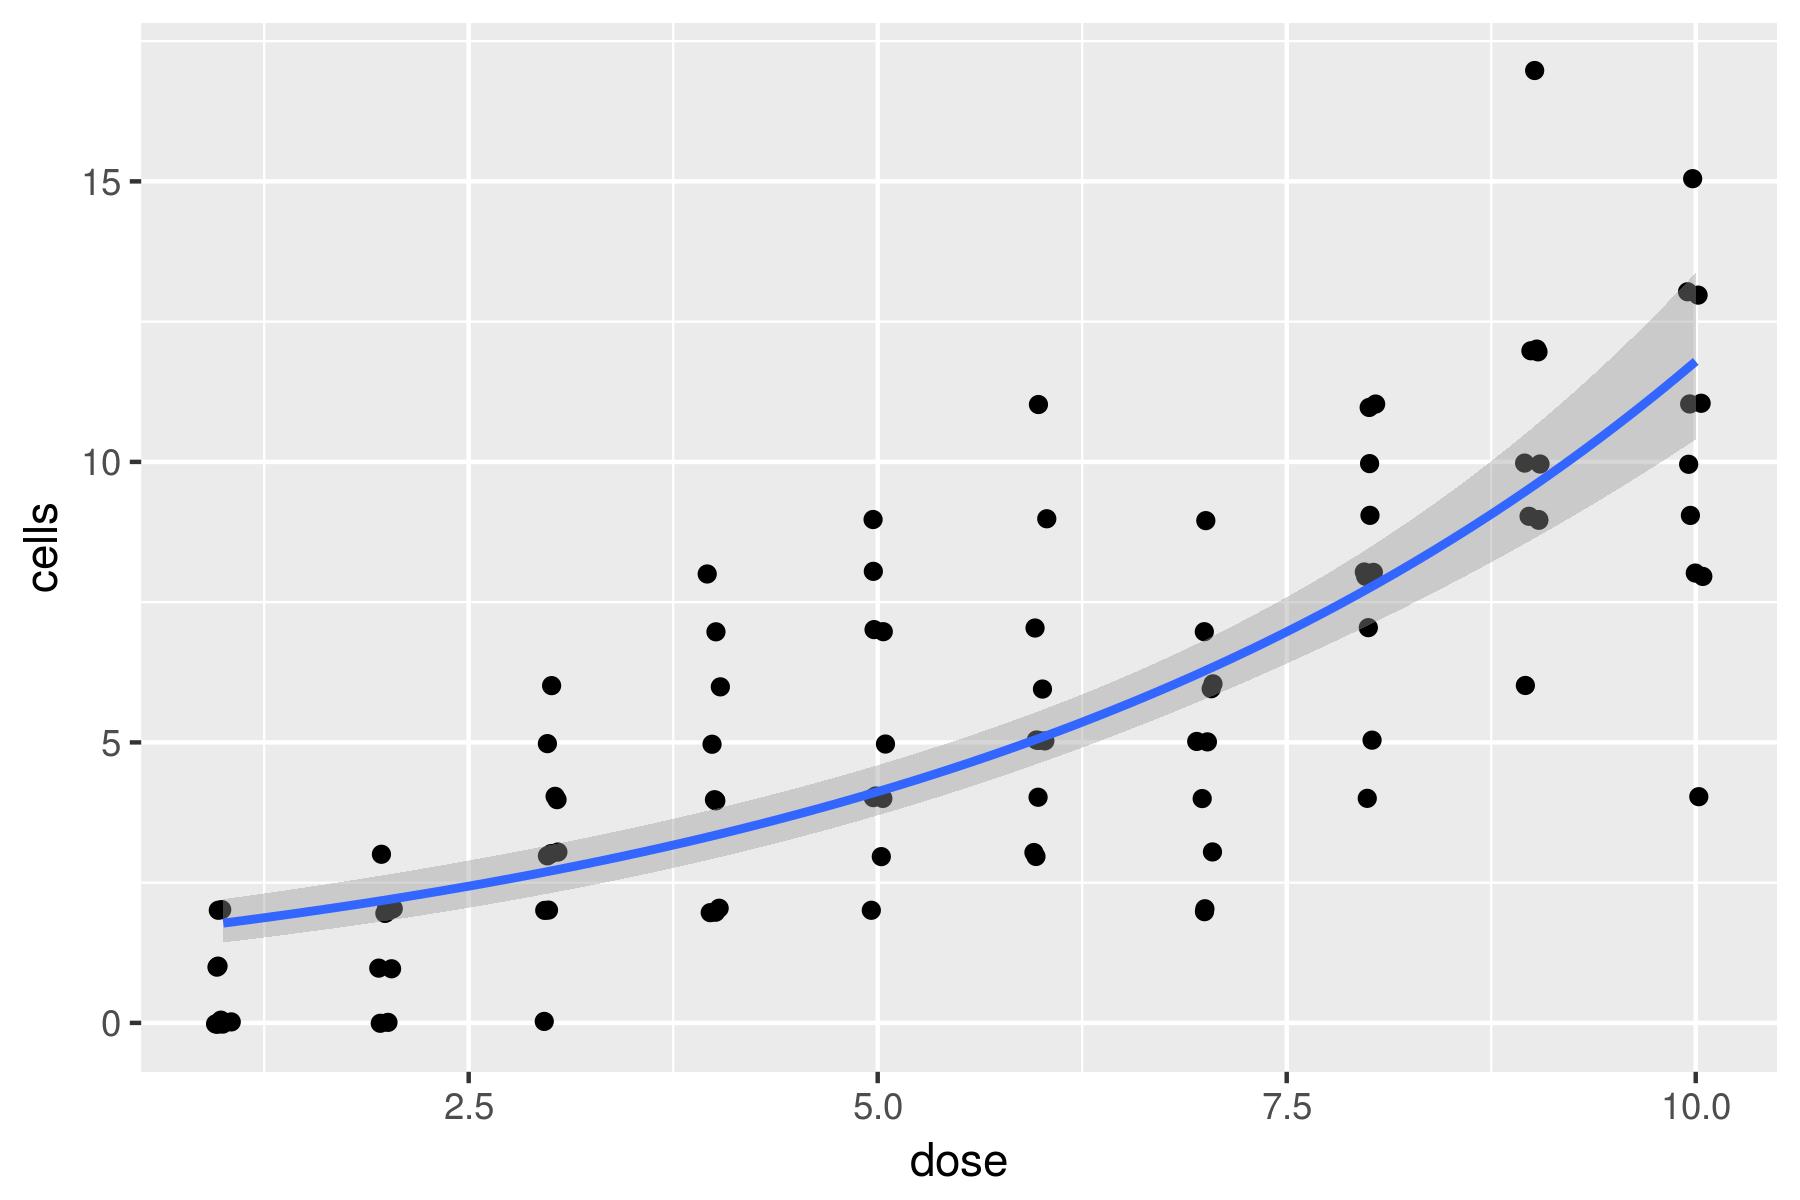
Ví dụ biểu đồ hồi quy Poisson

Generalized Linear Models in R

Tóm tắt các bước

  • Vẽ điểm không chồng lấp
  • Thêm đường xu hướng Poisson
  • Chỉnh sửa biểu đồ (chưa làm ở đây)
Generalized Linear Models in R

Hãy luyện tập!

Generalized Linear Models in R

Preparing Video For Download...