Giới thiệu chuỗi thời gian
Phát hiện bất thường với Python

Bekhruz (Bex) Tuychiev
Kaggle Master, Data Science Content Creator
Bộ dữ liệu cổ phiếu Google
import pandas as pd

google = pd.read_csv("google.csv")
google.head()
              Open    High     Low   Close    Volume
Date
2006-01-03  211.47  218.05  209.32  217.83  13137450
2006-01-04  222.17  224.70  220.09  222.84  15292353
2006-01-05  223.22  226.00  220.97  225.85  10815661
2006-01-06  228.66  235.49  226.85  233.06  17759521
2006-01-09  233.44  236.94  230.70  233.68  12795837
Kiểu dữ liệu DateTime
print(google['Date'].dtype)
object
google['Date'] = pd.to_datetime(google['Date'])

print(google.dtypes)
Date      datetime64[ns]
Open             float64
High             float64
...
Trích xuất đặc trưng
google['day_of_week'] = google['Date'].dt.day_of_week google['day_of_month'] = google['Date'].dt.day google['month'] = google['Date'].dt.monthgoogle.sample(5)
      Date    Open     Low   Close   Volume  day_of_week  month   day_of_month
2016-02-29  721.00  716.84  717.22  2237474            0      2             29
2007-01-24  242.46  241.89  249.78  6074077            2      1             24
2007-05-24  237.81  235.99  237.40  4200474            3      5             24
2008-09-16  213.19  212.96  221.69  6991767            1      9             16
2008-03-31  218.04  216.22  220.46  4446368            0      3             31
DatetimeIndex
google.set_index("Date", inplace=True)

google.head()
              Open    High     Low   Close    Volume  day_of_week  month  \
Date
2006-01-03  211.47  218.05  209.32  217.83  13137450            1      1
2006-01-04  222.17  224.70  220.09  222.84  15292353            2      1
2006-01-05  223.22  226.00  220.97  225.85  10815661            3      1
2006-01-06  228.66  235.49  226.85  233.06  17759521            4      1
2006-01-09  233.44  236.94  230.70  233.68  12795837            0      1
Chọn khoảng thời gian
google["2008": "2010"].head()
              Open    High     Low   Close   Volume  day_of_week  month  \
Date
2008-01-02  346.78  349.03  339.20  342.94  4306848            2      1
2008-01-03  342.97  343.77  338.60  343.01  3252846            3      1
2008-01-04  340.18  340.82  327.83  328.83  5359834            4      1
2008-01-07  327.30  331.47  318.99  324.95  6404945            0      1
2008-01-08  326.83  330.31  315.82  316.16  5341949            1      1
Chọn khoảng thời gian
google["2012-03": "2015-10-04"].head()
              Open    High     Low   Close   Volume  day_of_week  month  \
Date
2012-03-01  311.44  313.16  309.38  311.51  2238010            3      3
2012-03-02  311.31  312.31  310.47  310.94  1573214            4      3
2012-03-05  310.53  311.56  306.00  307.43  1593250            0      3
2012-03-06  304.33  304.71  297.22  302.78  3175216            1      3
2012-03-07  304.83  305.90  303.23  303.70  1264892            2      3
Nạp dữ liệu với DatetimeIndex
google = pd.read_csv("google.csv", parse_dates=["Date"], index_col="Date")

google.head()
              Open    High     Low   Close    Volume
Date
2006-01-03  211.47  218.05  209.32  217.83  13137450
2006-01-04  222.17  224.70  220.09  222.84  15292353
2006-01-05  223.22  226.00  220.97  225.85  10815661
2006-01-06  228.66  235.49  226.85  233.06  17759521
2006-01-09  233.44  236.94  230.70  233.68  12795837
Vẽ chuỗi thời gian
import matplotlib.pyplot as plt

google["Close"].plot(color="red")

plt.title("""Giá đóng cửa cổ phiếu Google
2006–2018.""")
plt.show()
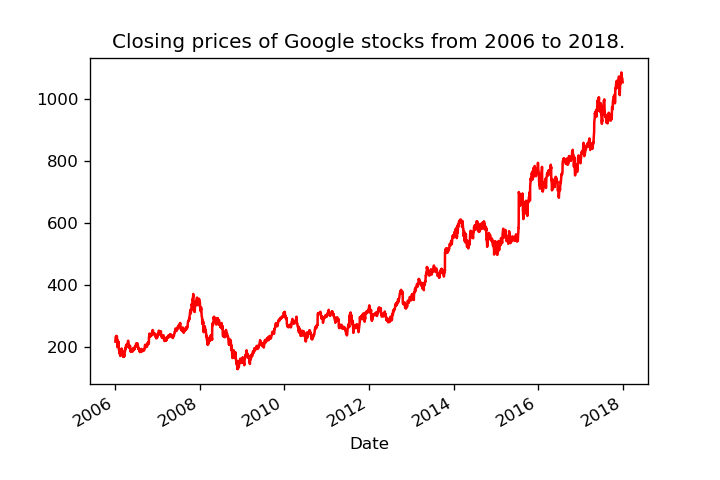
Vẽ chuỗi thời gian
google["2010": "2010-07-01"]['Close'].plot(color="green")

plt.title("Giá đóng cửa Google từ 01/2010 đến 07/2010.")
plt.show()
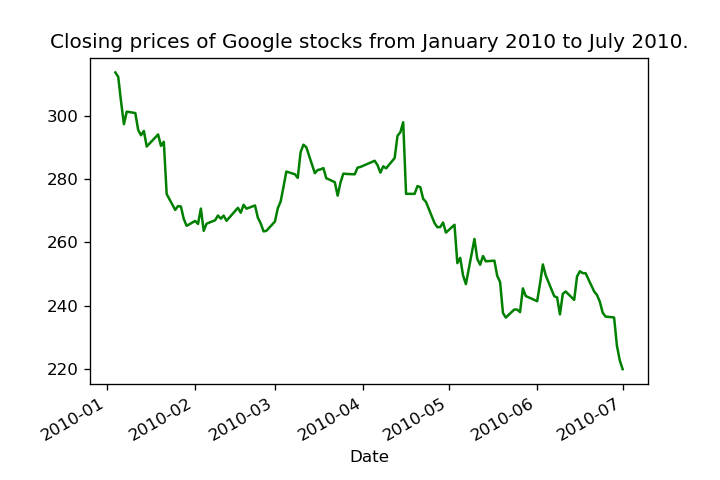
Vẽ chuỗi thời gian
google['Volume'].plot(color='red', figsize=(12, 4))

plt.title("Số cổ phiếu Google được giao dịch 2006–2018.")
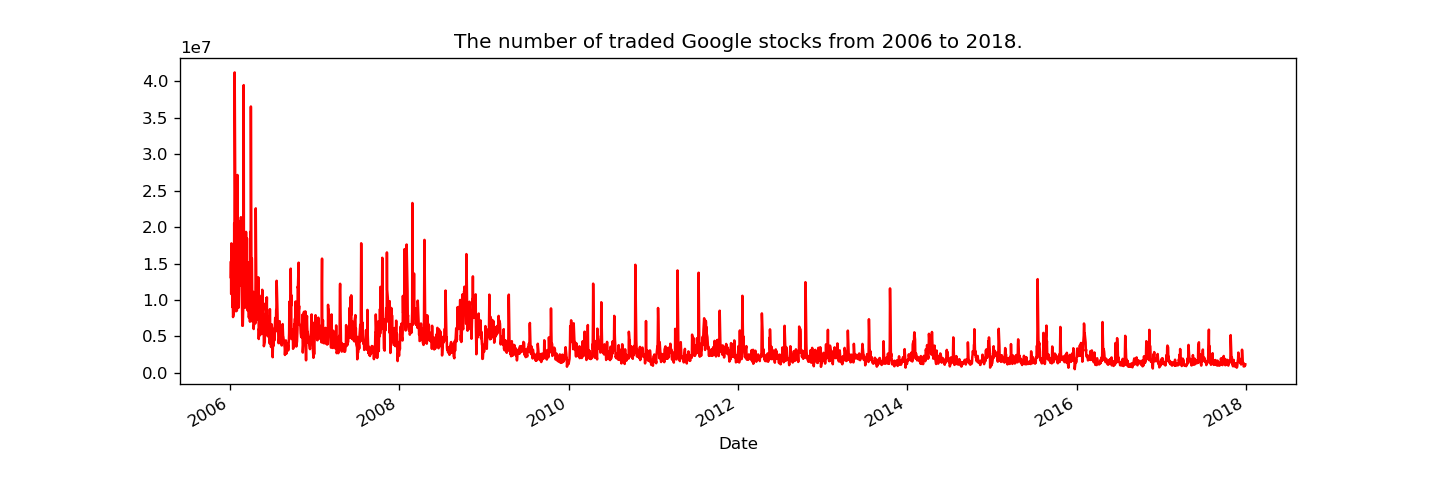
MAD cho chuỗi thời gian
from pyod.models.mad import MAD mad = MAD().fit(google[['Volume']])is_outlier = mad.labels_ == 1 print(len(google[is_outlier]))
236
IForest cho chuỗi thời gian
google['day_of_week'] = google.index.day_of_week
google['month'] = google.index.month
google['day_of_month'] = google.index.day

google.head()
              Open    High     Low   Close    Volume  day_of_week  month  \
Date
2006-01-03  211.47  218.05  209.32  217.83  13137450            1      1
2006-01-04  222.17  224.70  220.09  222.84  15292353            2      1
2006-01-05  223.22  226.00  220.97  225.85  10815661            3      1
2006-01-06  228.66  235.49  226.85  233.06  17759521            4      1
2006-01-09  233.44  236.94  230.70  233.68  12795837            0      1
IForest cho chuỗi thời gian
from pyod.models.iforest import IForest iforest = IForest().fit(google)# Generate probabilities probs = iforest.predict_proba(google) # Isolate the outliers is_outlier = probs[:, 1] > 0.75 outliers = google[is_outlier] print(len(outliers))
60
Ayo berlatih!
Phát hiện bất thường với Python

