Thống kê theo nhóm với seaborn

Nhập và quản lý dữ liệu tài chính bằng Python

Stefan Jansen

Instructor

Biểu đồ phân loại với seaborn

  • Cách vẽ chuyên biệt cho biến phân loại và số
  • Trực quan hóa ước lượng thống kê tóm tắt theo nhóm
  • Hiểu tác động của nhóm lên biến số
  • So sánh bằng các thước đo đặc trưng phân phối
  • Ví dụ: Vốn hóa TB theo Ngành hoặc Năm IPO, kèm độ phân tán
Nhập và quản lý dữ liệu tài chính bằng Python

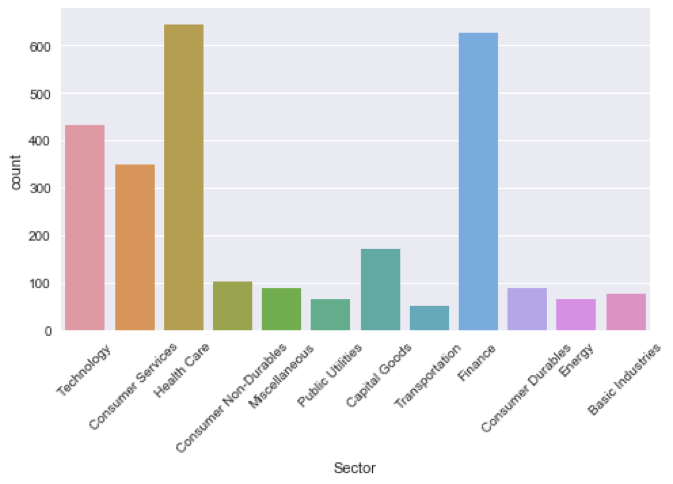
Cơ bản: countplot

sns.countplot(x='Sector', data=nasdaq)
plt.xticks(rotation=45)
countplot.png

Nhập và quản lý dữ liệu tài chính bằng Python

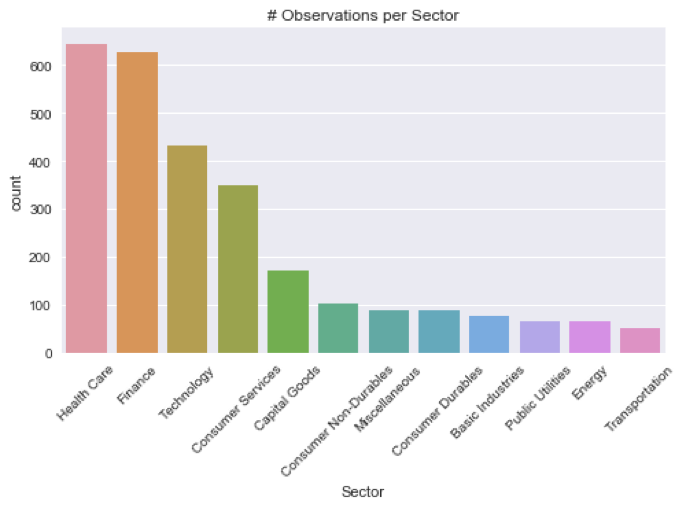
countplot, đã sắp xếp

sector_size = nasdaq.groupby('Sector').size()
order = sector_size.sort_values(ascending=False)
order.head()
Sector
Health Care          645
Finance              627
Technology           433
...
order = order.index.tolist()
['Health Care', 'Finance', ..., 'Energy', 'Transportation']
Nhập và quản lý dữ liệu tài chính bằng Python

countplot, đã sắp xếp

sns.countplot(x='Sector', data=nasdaq, order=order)
plt.xticks(rotation=45)
plt.title('# Observations per Sector’)
countplot_sorted.png

Nhập và quản lý dữ liệu tài chính bằng Python

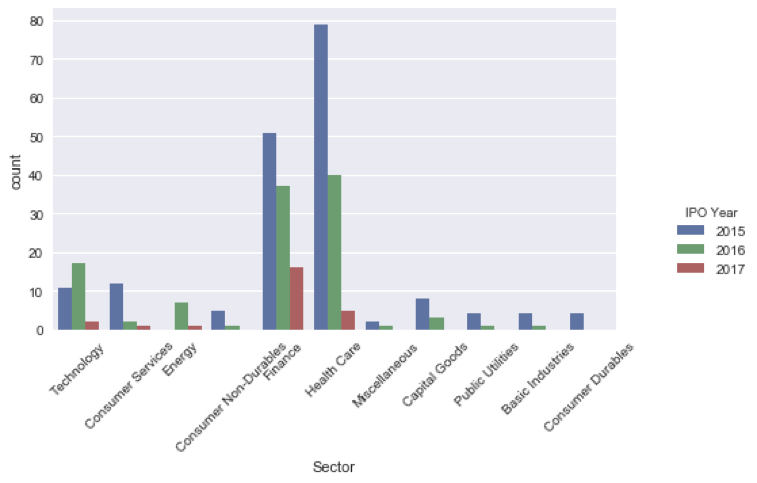
countplot, đa nhóm

recent_ipos = nasdaq[nasdaq['IPO Year'] > 2014]
recent_ipos['IPO Year'] = recent_ipos['IPO Year'].astype(int)
sns.countplot(x='Sector', hue='IPO Year', data=recent_ipos)
countplot_mc.png

Nhập và quản lý dữ liệu tài chính bằng Python

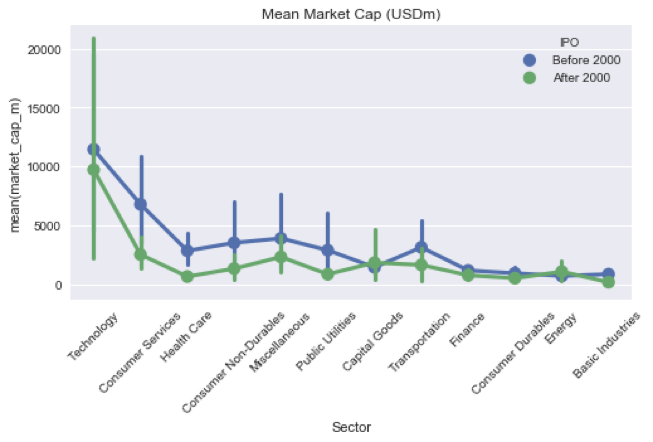
So sánh thống kê với PointPlot

nasdaq['IPO'] = nasdaq['IPO Year'].apply(lambda x: 'After 2000' if x > 2000 else 'Before 2000')
sns.pointplot(x='Sector', y='market_cap_m', hue='IPO', data=nasdaq)
plt.xticks(rotation=45); plt.title('Mean Market Cap')
pointplot.png

Nhập và quản lý dữ liệu tài chính bằng Python

Ayo berlatih!

Nhập và quản lý dữ liệu tài chính bằng Python

Preparing Video For Download...