Phân phối theo danh mục với seaborn

Nhập và quản lý dữ liệu tài chính bằng Python

Stefan Jansen

Instructor

Phân phối theo danh mục

  • Phần trước: Thống kê tóm tắt
  • Số quan sát, trung bình theo danh mục
  • Bây giờ: trực quan hóa phân phối của biến theo mức của biến phân loại để so sánh
  • Ví dụ: Phân phối Vốn hóa theo Ngành hoặc Năm IPO
  • Chi tiết hơn thống kê tóm tắt
Nhập và quản lý dữ liệu tài chính bằng Python

Làm sạch dữ liệu: loại bỏ ngoại lệ

nasdaq = pd.read_excel('listings.xlsx', sheet_name='nasdaq', 
                        na_values='n/a')
nasdaq['market_cap_m'] = nasdaq['Market Capitalization'].div(1e6)

nasdaq = nasdaq[nasdaq.market_cap_m > 0] # Active companies only
outliers = nasdaq.market_cap_m.quantile(.9) # Outlier threshold
nasdaq = nasdaq[nasdaq.market_cap_m < outliers] # Remove outliers
Nhập và quản lý dữ liệu tài chính bằng Python

Boxplot: tứ phân vị và ngoại lệ

import seaborn as sns
sns.boxplot(x='Sector', y='market_cap_m', data=nasdaq)
plt.xticks(rotation=75);
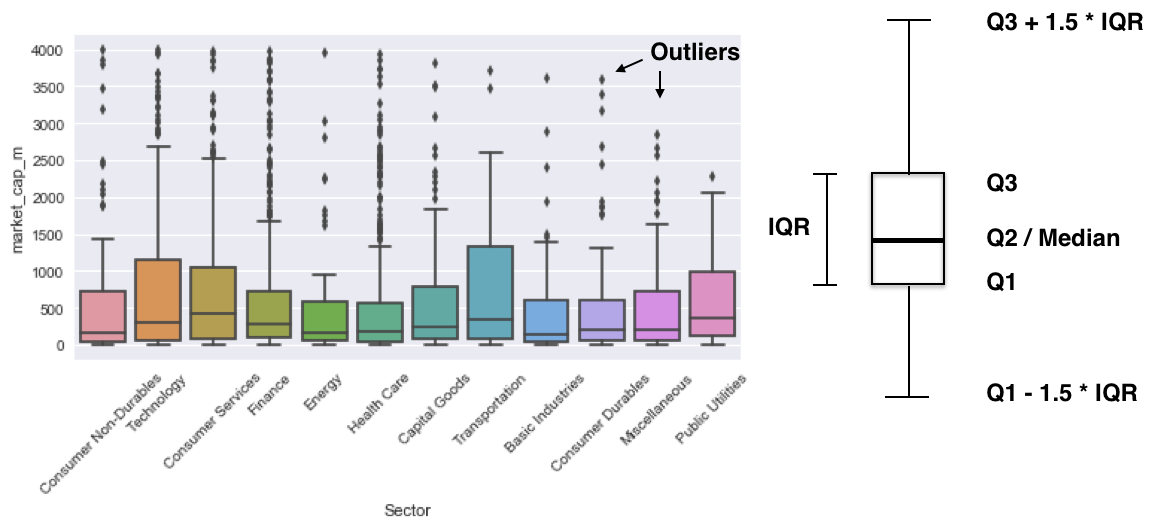
Các tứ phân vị

Nhập và quản lý dữ liệu tài chính bằng Python

Biến thể: SwarmPlot

sns.swarmplot(x='Sector', y='market_cap_m', data=nasdaq)
plt.xticks(rotation=75)
plt.show()
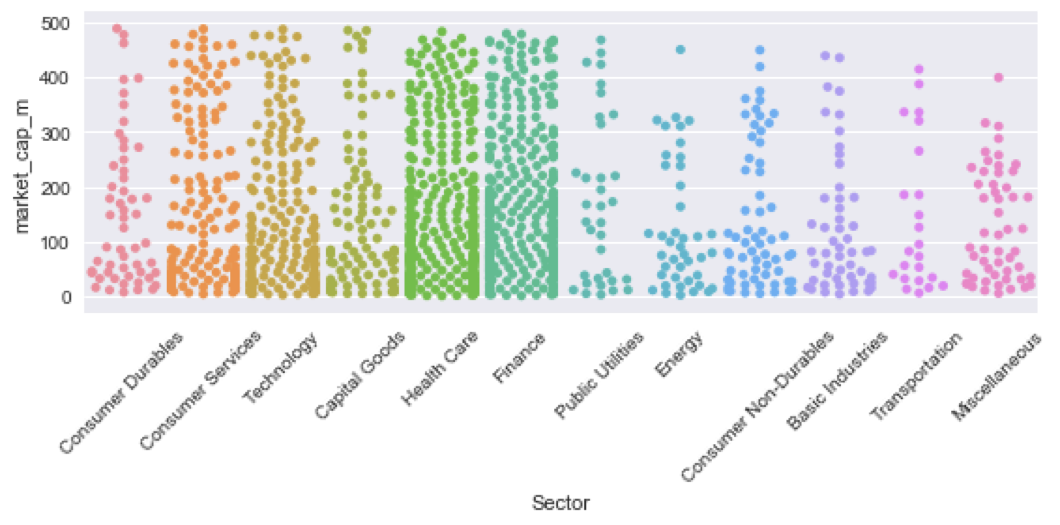
swarmplot

Nhập và quản lý dữ liệu tài chính bằng Python

Hãy thực hành!

Nhập và quản lý dữ liệu tài chính bằng Python

Preparing Video For Download...