Bảng màu phân loại
Nâng cấp trực quan hóa dữ liệu của bạn với Python

Nick Strayer
Instructor
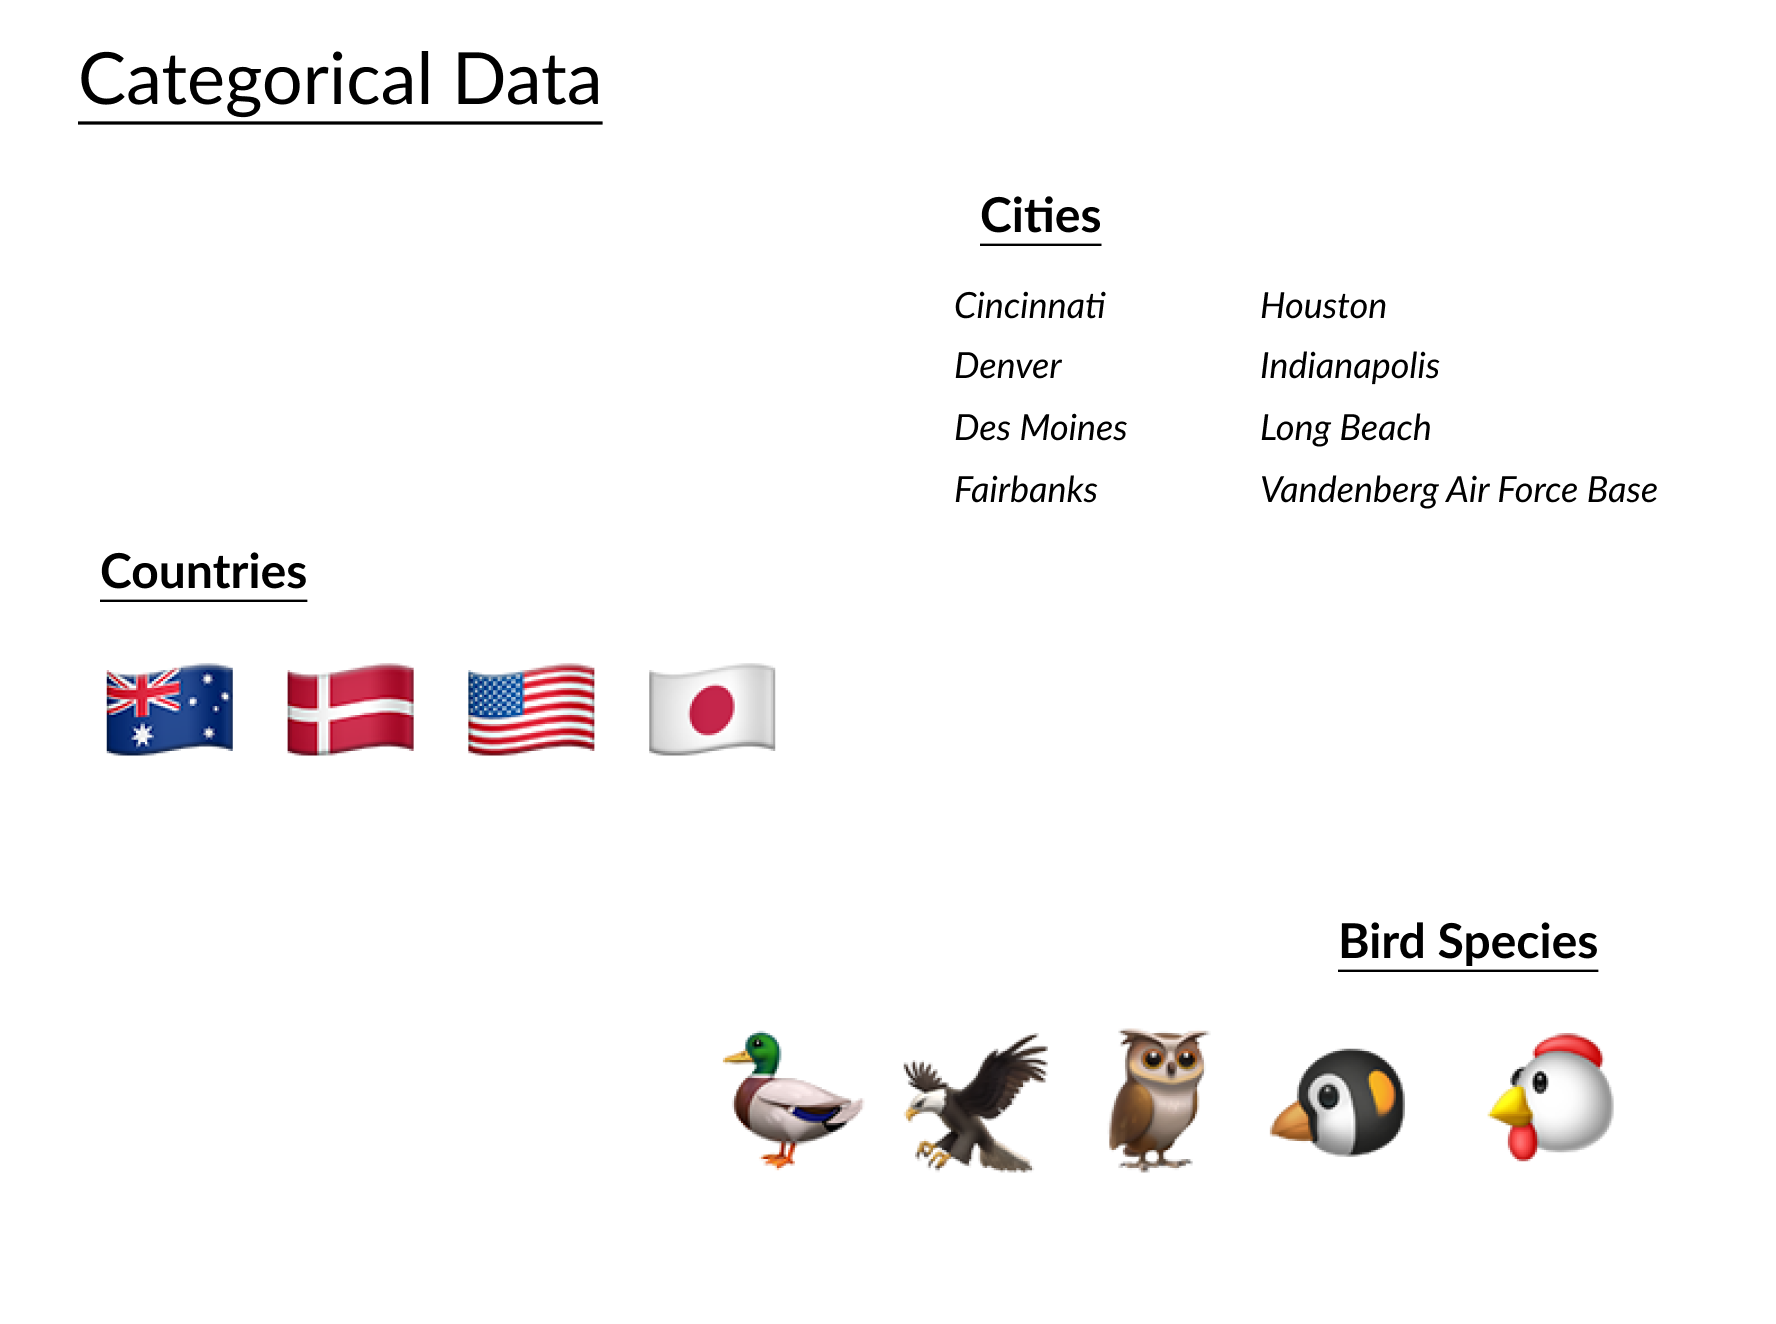
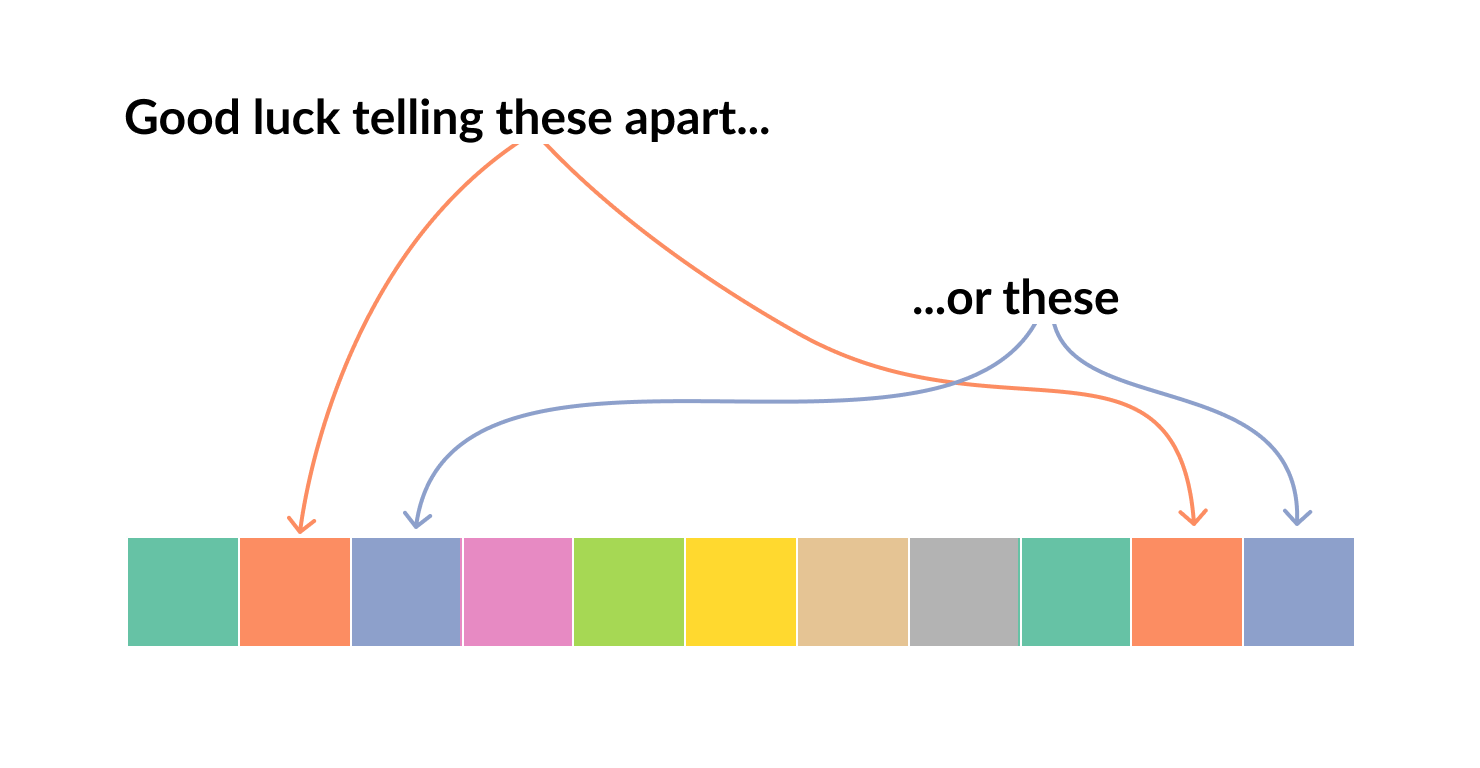
Giới hạn cảm nhận
- Cố gắng giới hạn ≤ 10 danh mục
- Lưu ý người mù màu
sns.palplot(sns.color_palette('Set2', 11))
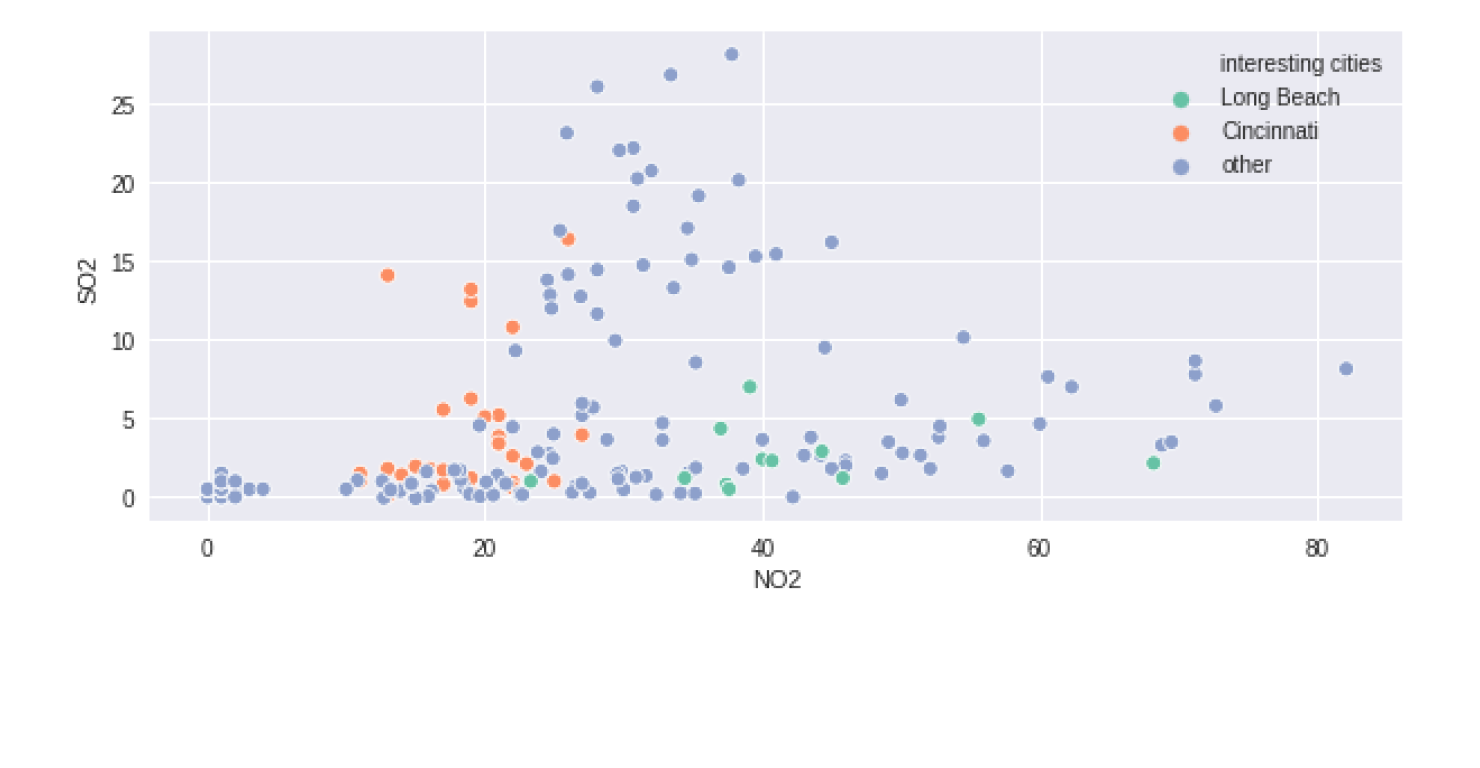
# Assign a new column to dataframe the desired combos
pollution['interesting cities'] = [x if x in ['Long Beach', 'Cincinnati']
                                   else 'other' for x in pollution['city'] ]

sns.scatterplot(x="NO2", y="SO2", hue = 'interesting cities', palette='Set2',
                data=pollution.query('year == 2014 & month == 12'))
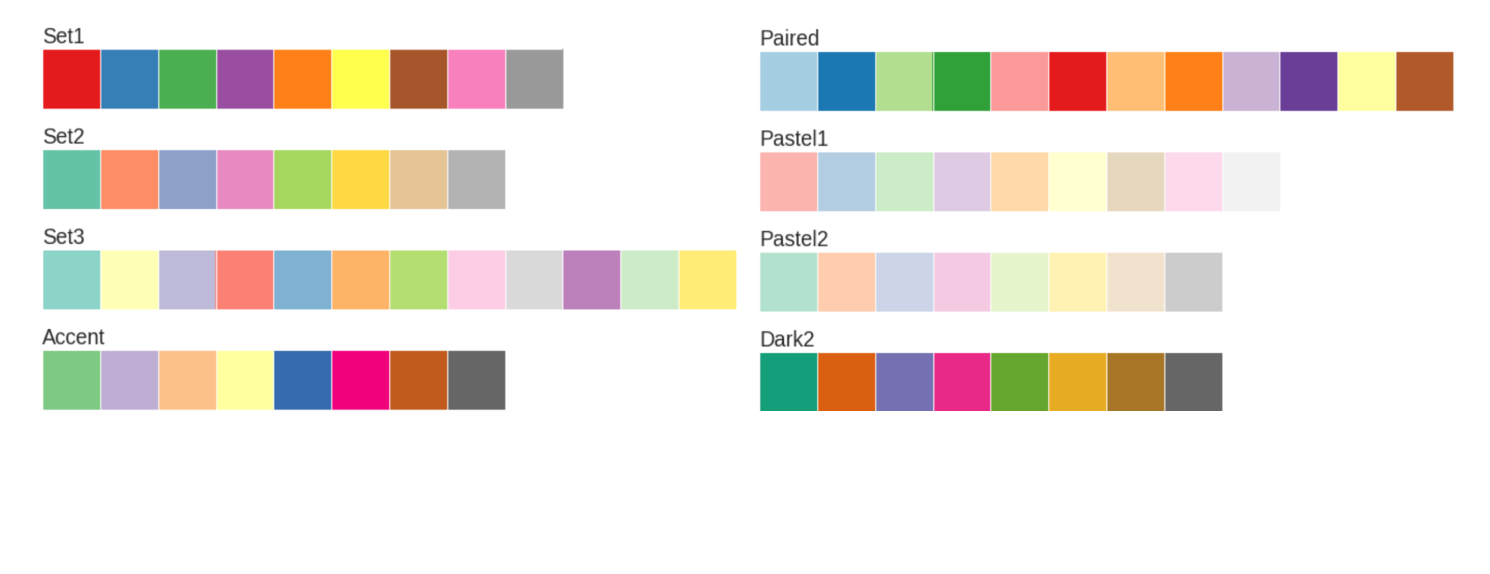
colorbrewer_palettes = ['Set1',   'Set2',    'Set3',    'Accent',
                        'Paired', 'Pastel1', 'Pastel2', 'Dark2']

for pal in colorbrewer_palettes:
    sns.palplot(pal=sns.color_palette(pal))
    plt.title(pal, loc = 'left')
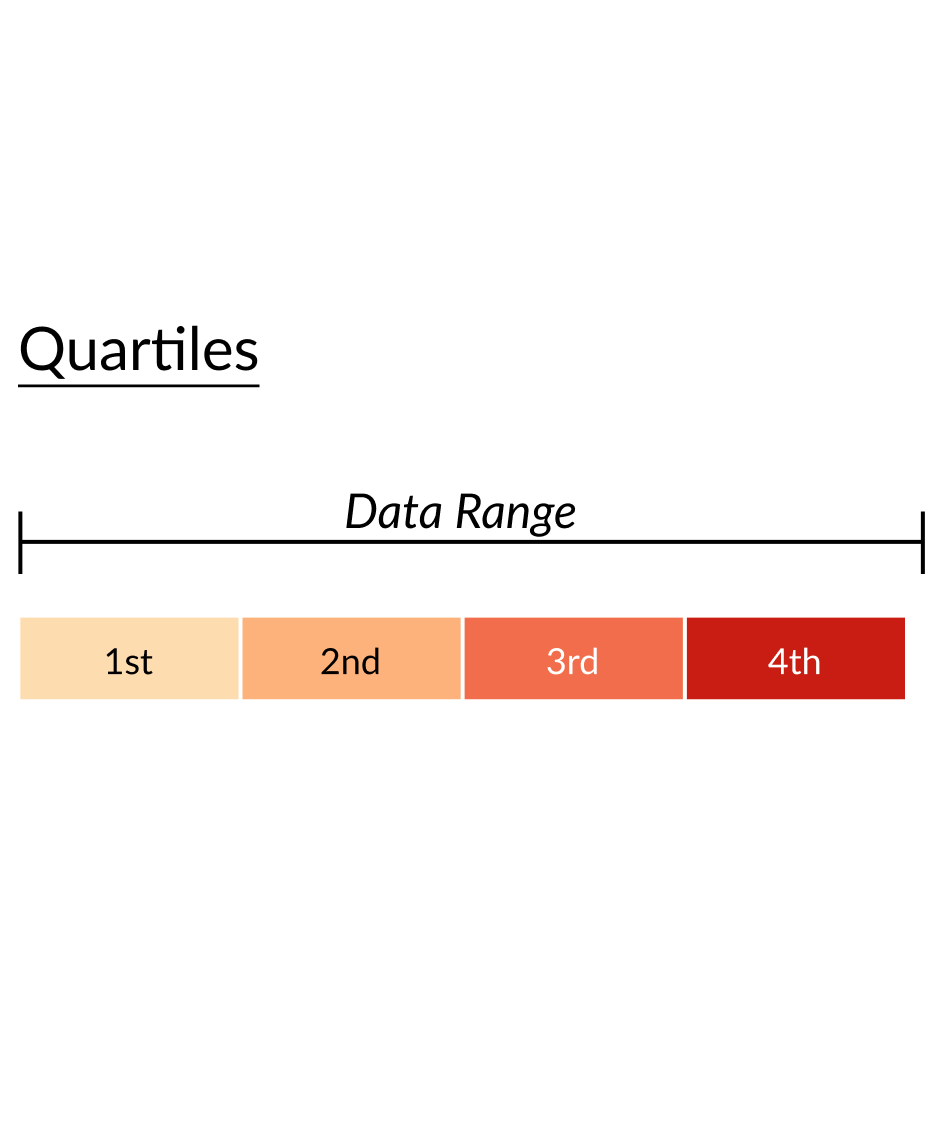
Dữ liệu thứ bậc (a)
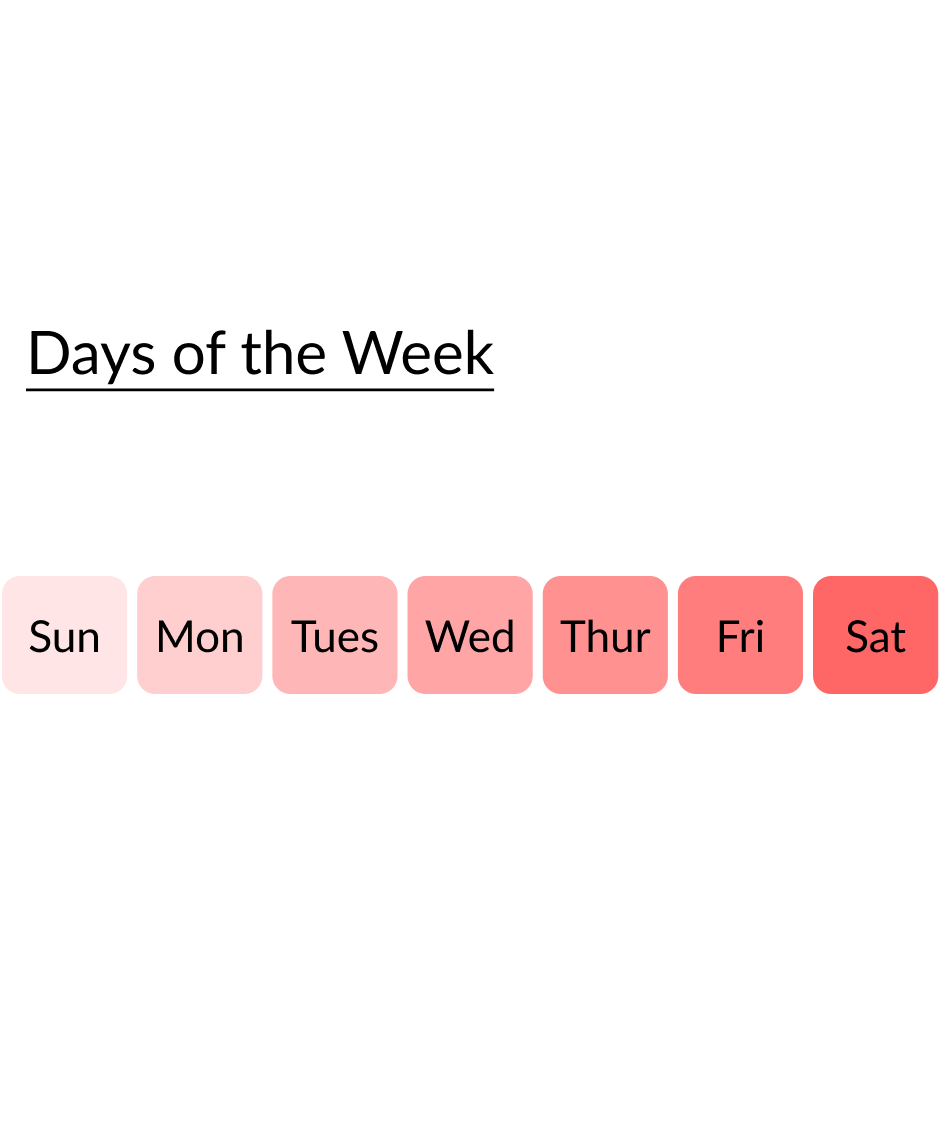
Dữ liệu thứ bậc (b)
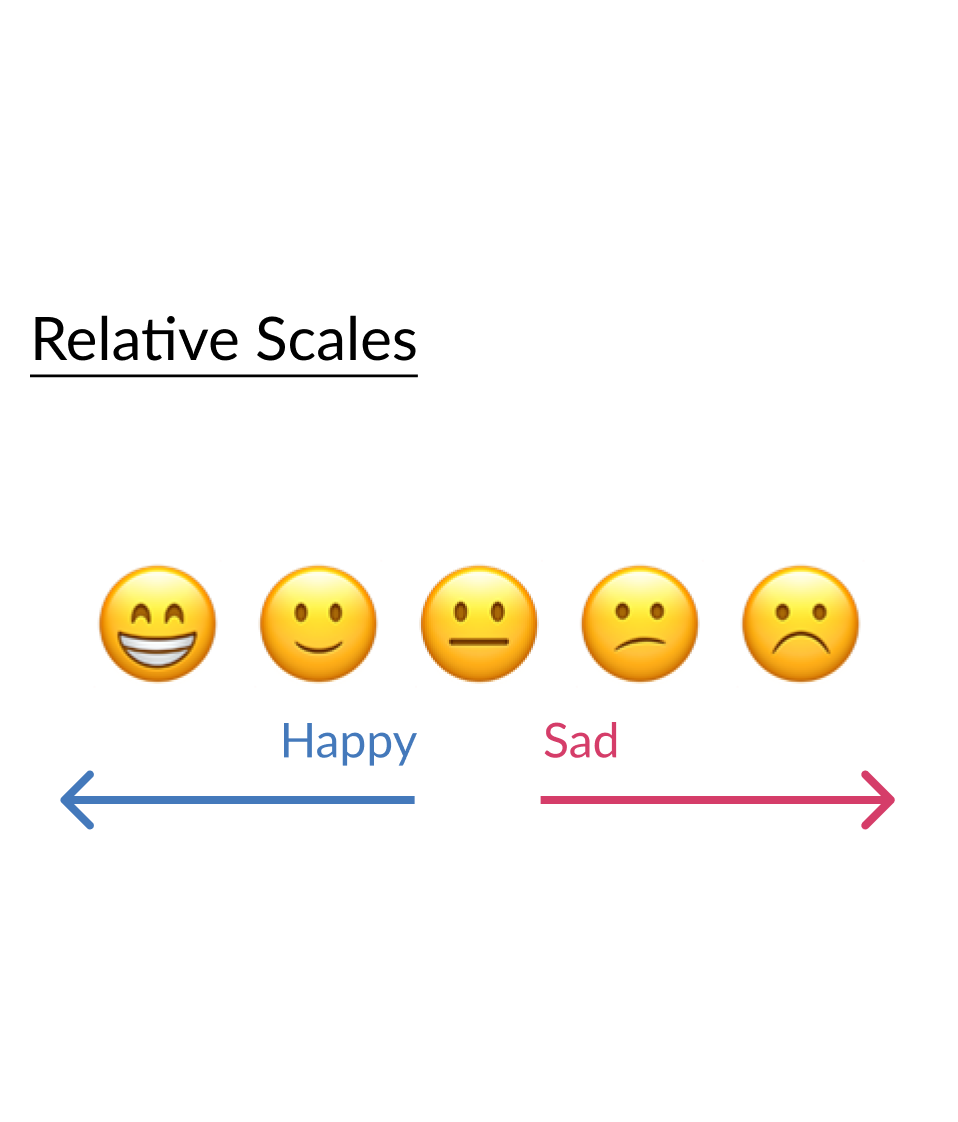
Dữ liệu thứ bậc (c)
colorbrewer_palettes = ['Reds', 'Blues', 'YlOrBr', 'PuBuGn', 'GnBu', 'Greys']

for i, pal in enumerate(colorbrewer_palettes):
    sns.palplot(pal=sns.color_palette(pal, n_colors=i+4))

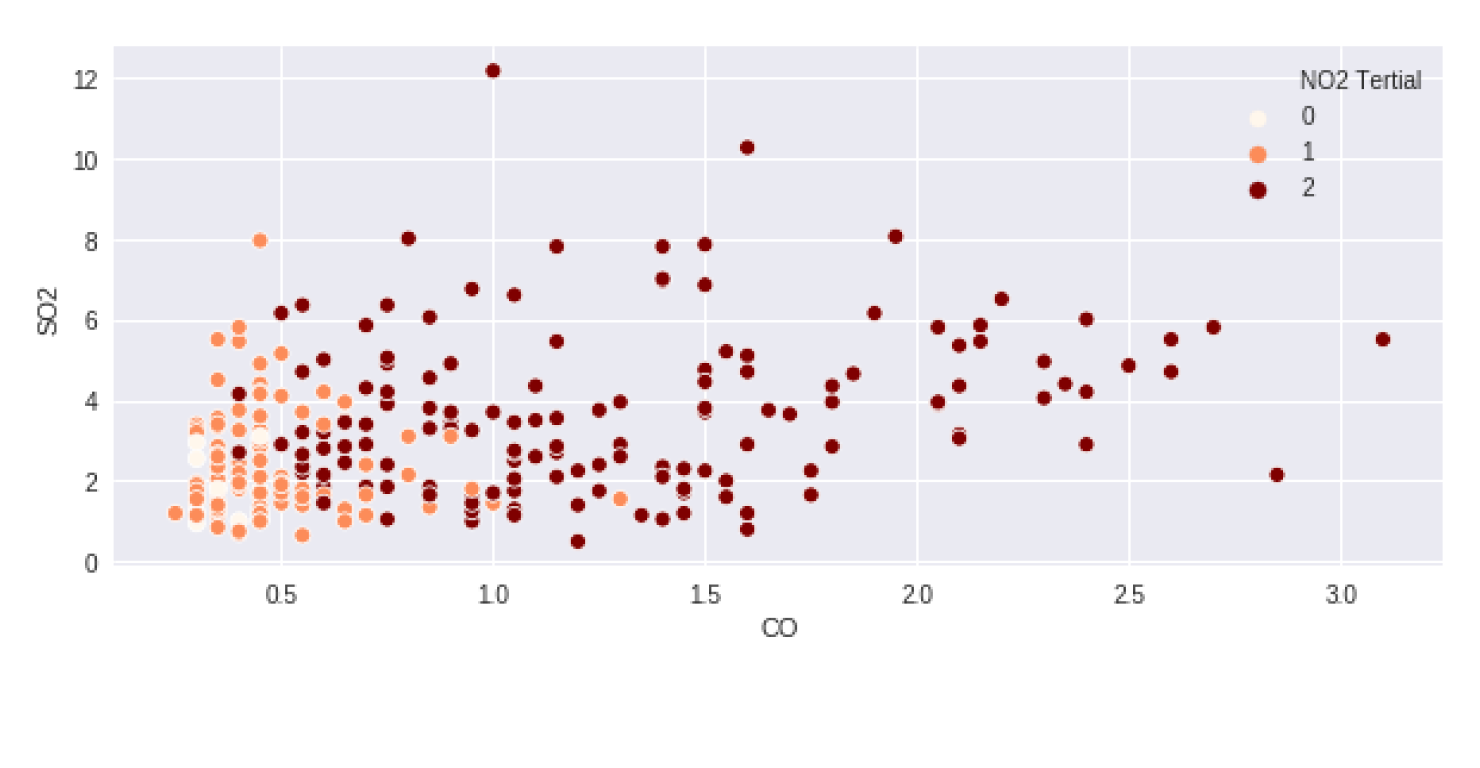
# Make a tertials column using qcut()
pollution['NO2 Tertial'] = pd.qcut(pollution['NO2'], 3, labels = False)

# Plot colored by the computer tertials
sns.scatterplot(x="CO", y="SO2", hue='NO2 Tertial', palette="OrRd",
                data=pollution.query("city == 'Long Beach' & year == 2014"))