Biến dự báo số
Mô hình hóa với tidymodels trong R

David Svancer
Data Scientist
Biến dự báo tương quan
Tương quan đo độ mạnh quan hệ tuyến tính giữa hai biến số
- Trong khoảng -1 đến 1
Biến dự báo tương quan cao gần -1 hoặc 1
- Cung cấp thông tin dư thừa
- Gây vấn đề khi ước lượng mô hình (đa cộng tuyến)
ggplot(leads_training,
       aes(x = pages_per_visit, y = total_clicks)) +
  geom_point()  +
  labs(title = 'Total Clicks vs Average Page Visits',
       y = 'Total Clicks', x = 'Average Pages per Visit')
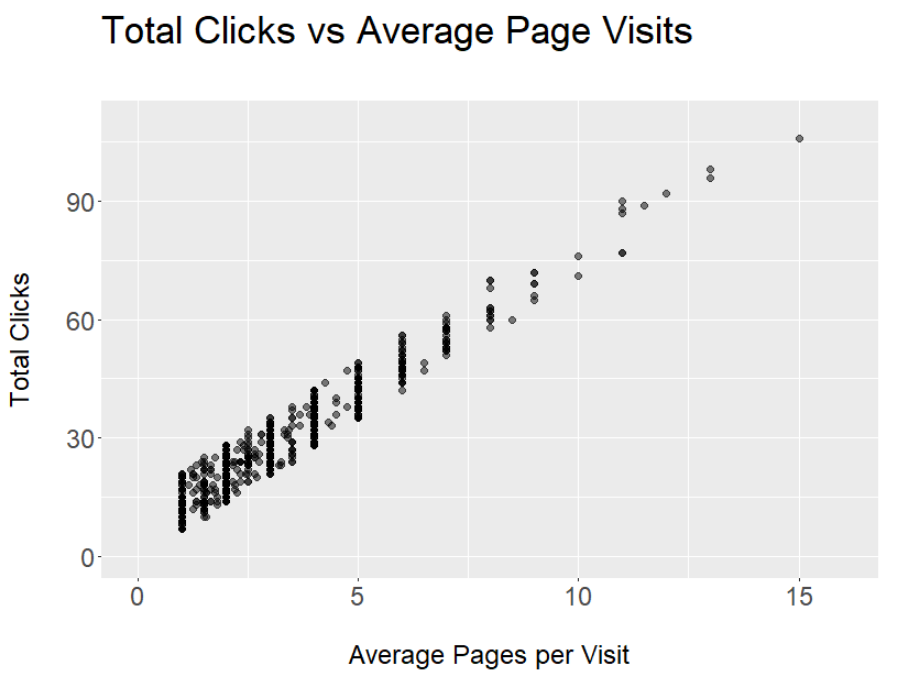
Tìm biến dự báo tương quan
Tính ma trận tương quan
- Truyền tập dữ liệu vào hàm
select_if()- Dùng đối số
is.numeric
- Dùng đối số
- Truyền vào hàm
cor()
leads_training %>%select_if(is.numeric) %>%cor()
              total_visits total_time pages_per_visit total_clicks
total_visits        1.00       0.01            0.43         0.42
total_time          0.01       1.00            0.02         0.01
pages_per_visit     0.43       0.02            1.00         0.96
total_clicks        0.42       0.01            0.96         1.00
Xử lý các biến dự báo tương quan
Loại bỏ đa cộng tuyến với recipes
- Tạo đối tượng
recipebằng hàmrecipe() - Truyền vào
step_corr()- Thêm mọi cột số
- Tên cột cách nhau bằng dấu phẩy
- Cung cấp
thresholdtương quan- Giá trị tuyệt đối
- Ngưỡng 0.9 loại các tương quan ≥ 0.9 hoặc ≤ -0.9
- Thêm mọi cột số
leads_cor_rec <- recipe(purchased ~ ., data = leads_training) %>%step_corr(total_visits, total_time, pages_per_visit, total_clicks, threshold = 0.9)leads_cor_rec
Data Recipe
Inputs:
      role #variables
   outcome          1
 predictor          6

Operations:
Correlation filter on total_visits,..., total_clicks
Chọn biến dự báo theo kiểu dữ liệu
all_outcomes()- Chọn biến kết quả
all_numeric()- Chọn mọi biến số
- Sẽ gồm cả biến kết quả nếu biến đó là số
- Chọn mọi biến số
Chọn biến dự báo số cho các bước recipe
- Truyền
all_numeric()vào các hàmstep_*() - Nếu biến kết quả là số, truyền thêm
-all_outcomes()
leads_cor_rec <- recipe(purchased ~ ., data = leads_training) %>%step_corr(all_numeric(), threshold = 0.9)leads_cor_rec
Data Recipe
Inputs:
      role #variables
   outcome          1
 predictor          6

Operations:
Correlation filter on all_numeric()
Huấn luyện và áp dụng recipe
- Huấn luyện với
prep()- Cung cấp
leads_trainingđể huấn luyện
- Cung cấp
- Áp dụng với
bake()pages_per_visitbị loại khỏileads_testpages_per_visitcũng sẽ bị loại khỏi mọi dữ liệu về sau
leads_cor_rec %>%prep(training = leads_training) %>%bake(new_data = leads_test)
# A tibble: 332 x 6
total_visits total_time total_clicks ... purchased
    <dbl>       <dbl>        <dbl>   ...   <fct>
 1   8          100           24     ...    no
 2   4          1346          22     ...    yes
 3   3          176           27     ...    no
 4   2          16            12     ...    no
 5   9          1022          12     ...    yes
# ... with 327 more rows
Chuẩn hóa
Chuẩn hóa (chuẩn tâm và tỉ lệ) biến số
- Trừ đi trung bình
- Chia cho độ lệch chuẩn
- Chuyển dữ liệu sang đơn vị độ lệch chuẩn
- Biến đã biến đổi có trung bình 0 và độ lệch chuẩn 1
Biến total_time trong leads_training
- 1.273 giây trên website cao hơn trung bình 1.19 độ lệch chuẩn

Kết hợp các bước tiền xử lý dữ liệu
Chuẩn hóa biến dự báo số với recipes
step_normalize()- Tên cột hoặc bộ chọn
all_numeric() - Áp dụng trung bình và độ lệch chuẩn từ dữ liệu huấn luyện cho dữ liệu mới
- Tên cột hoặc bộ chọn
Có thể thêm nhiều hàm step_*() vào một recipe
- Thứ tự có ý nghĩa
leads_norm_rec <- recipe(purchased ~ ., data = leads_training) %>%step_corr(all_numeric(), threshold = 0.9) %>% step_normalize(all_numeric())leads_norm_rec
Data Recipe
Inputs:
      role #variables
   outcome          1
 predictor          6

Operations:
Correlation filter on all_numeric()
Centering and scaling for all_numeric()
Biến đổi dữ liệu kiểm thử
pages_per_vist được loại bỏ và các biến dự báo số được chuẩn hóa
leads_norm_rec %>%
  prep(training = leads_training) %>%
  bake(new_data = leads_test)
# A tibble: 332 x 6
 total_visits  total_time  total_clicks  lead_source   us_location  purchased
      <dbl>      <dbl>        <dbl>        <fct>          <fct>      <fct>
 1    0.864     -0.984     -0.360        direct_traffic   west        no
 2   -0.151      1.33      -0.506        direct_traffic   northeast   yes
 3   -0.405     -0.843     -0.140        organic_search   west        no
 4   -0.659     -1.14      -1.24         email            midwest     no
 5    1.12       0.725     -1.24         direct_traffic   west        yes
# ... with 327 more rows
Ayo berlatih!
Mô hình hóa với tidymodels trong R

