Mô hình hóa với tidymodels trong R
David Svancer
Data Scientist
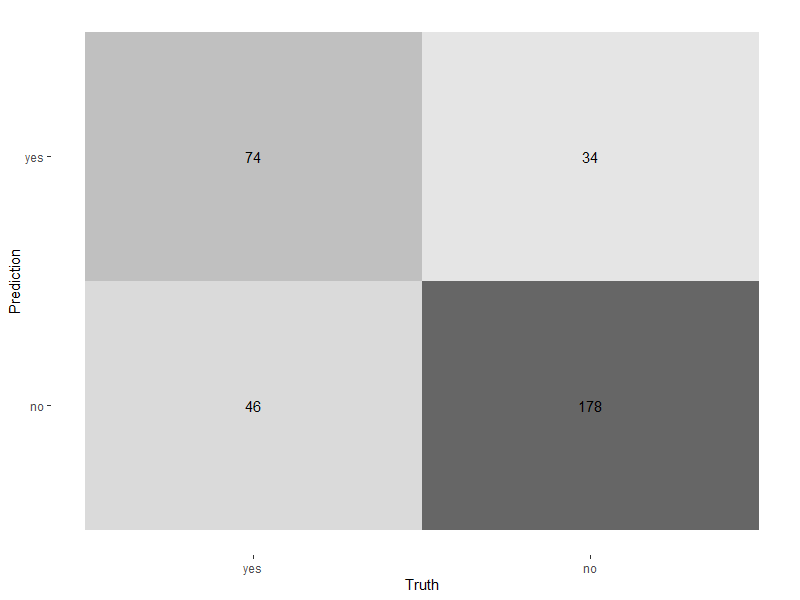
Heatmap với autoplot()
autoplot()type là 'heatmap'
conf_mat(leads_results, truth = purchased, estimate = .pred_class) %>%autoplot(type = 'heatmap')

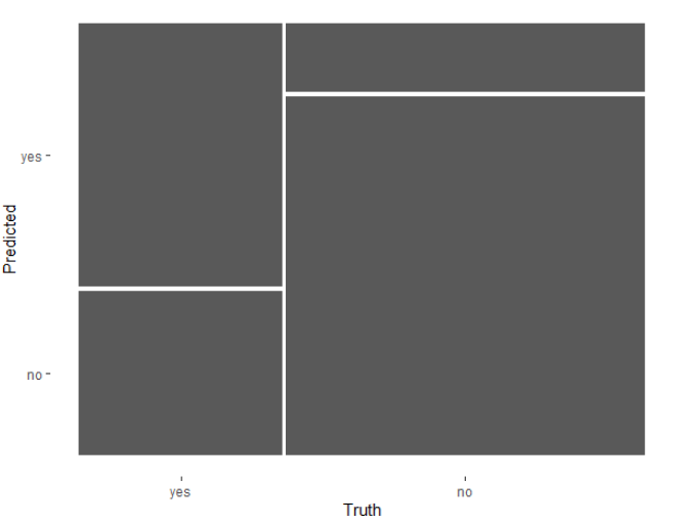
Biểu đồ mosaic với autoplot()
type là 'mosaic'
conf_mat(leads_results,
truth = purchased,
estimate = .pred_class) %>%
autoplot(type = 'mosaic')

Biểu đồ mosaic với autoplot()
type là 'mosaic'conf_mat(leads_results,
truth = purchased,
estimate = .pred_class) %>%
autoplot(type = 'mosaic')

Ngưỡng xác suất mặc định trong phân loại nhị phân là 0.5
leads_results
.pred_yes ≥ 0.5 thì .pred_class được đặt là 'yes' bởi hàm predict() trong tidymodelsleads_results
# A tibble: 332 x 4
purchased .pred_class .pred_yes .pred_no
<fct> <fct> <dbl> <dbl>
1 no no 0.134 0.866
2 yes yes 0.729 0.271
3 no no 0.133 0.867
4 no no 0.0916 0.908
5 yes yes 0.598 0.402
6 no no 0.128 0.872
7 yes no 0.112 0.888
8 no no 0.169 0.831
9 no no 0.158 0.842
10 yes yes 0.520 0.480
# ... with 322 more rows
Mô hình phân loại hoạt động thế nào trên nhiều ngưỡng?
.pred_yes của kết quả tập kiểm tra
| threshold | specificity | sensitivity |
|---|---|---|
| 0 | 0 | 1 |
| 0.11 | 0.01 | 0.98 |
| 0.15 | 0.05 | 0.97 |
| ... | ... | ... |
| 0.84 | 0.89 | 0.08 |
| 0.87 | 0.94 | 0.02 |
| 0.91 | 0.99 | 0 |
| 1 | 1 | 0 |
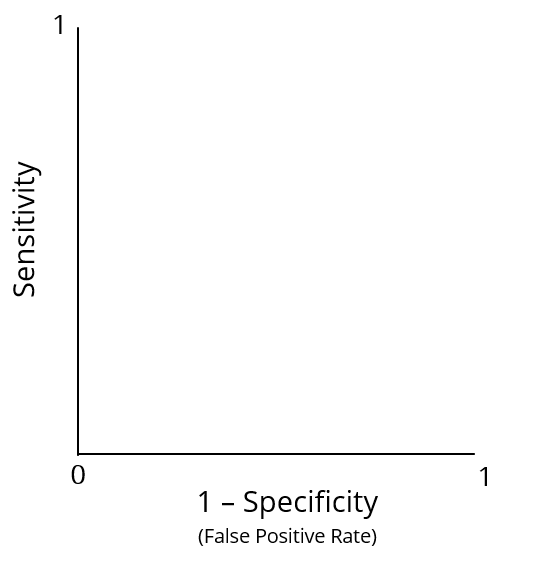
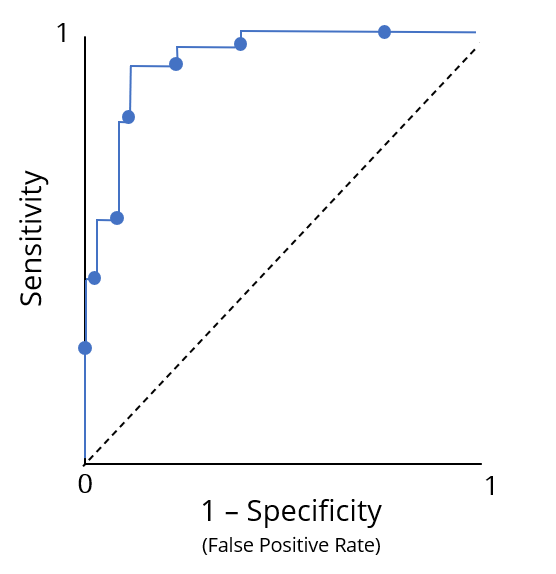
Đường cong ROC (receiver operating characteristic)

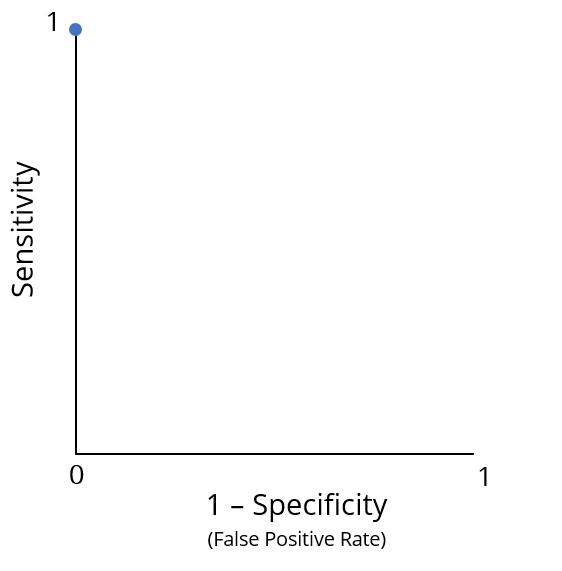
Hiệu suất tối ưu tại điểm (0, 1)
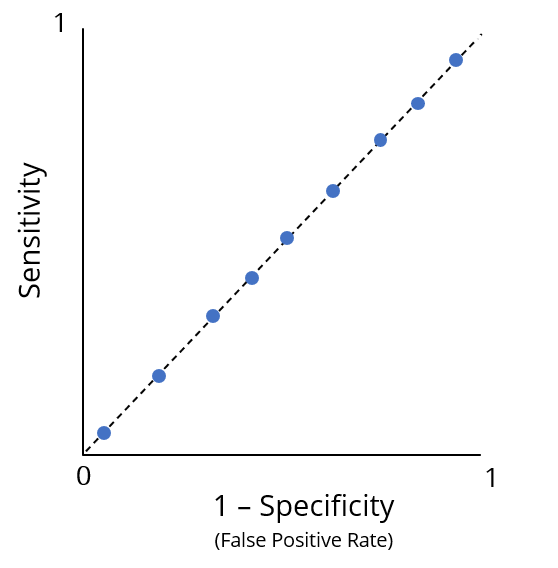
Hiệu suất kém

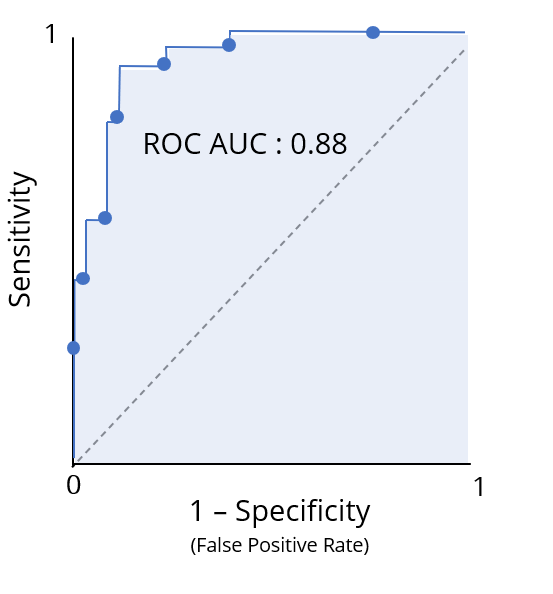
Diện tích dưới đường cong ROC (ROC AUC) tóm tắt thông tin đường cong ROC của mô hình phân loại trong một con số
Cách hiểu hữu ích như điểm chữ cái cho hiệu suất phân loại

Hàm roc_curve()
truth với nhãn thực.pred_yes trong tibble leads_results
.pred_yesleads_results %>%
roc_curve(truth = purchased, .pred_yes)
# A tibble: 331 x 3
.threshold specificity sensitivity
<dbl> <dbl> <dbl>
1 -Inf 0 1
2 0.0871 0 1
3 0.0888 0.00472 1
4 0.0893 0.00943 1
5 0.0896 0.0142 1
6 0.0902 0.0142 0.992
7 0.0916 0.0142 0.983
8 0.0944 0.0189 0.983
# ... with 323 more rows
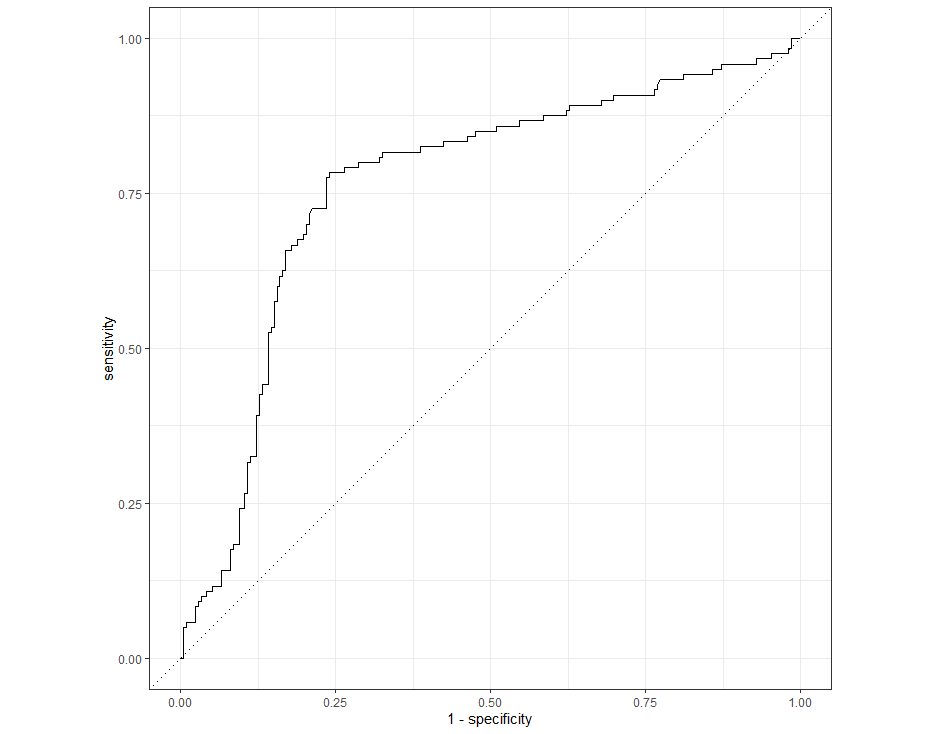
Truyền kết quả của roc_curve() vào autoplot() sẽ trả về biểu đồ đường cong ROC
leads_results %>%
roc_curve(truth = purchased, .pred_yes) %>%
autoplot()

Hàm roc_auc() từ yardstick sẽ tính ROC AUC
truthroc_auc(leads_results,
truth = purchased,
.pred_yes)
# A tibble: 1 x 3
.metric .estimator .estimate
<chr> <chr> <dbl>
1 roc_auc binary 0.763
Mô hình hóa với tidymodels trong R