Ghép tất cả lại với nhau

Bản đồ tương tác với leaflet trong R

Rich Majerus

Vice President of Strategy & Planning, Queens University of Charlotte

Ôn tập
  • Leaflet và htmlwidgets
  • Bản đồ nền
  • Marker hình tròn
  • Bảng màu
  • Đa giác
  • Lớp (layers)
  • Hiệu ứng

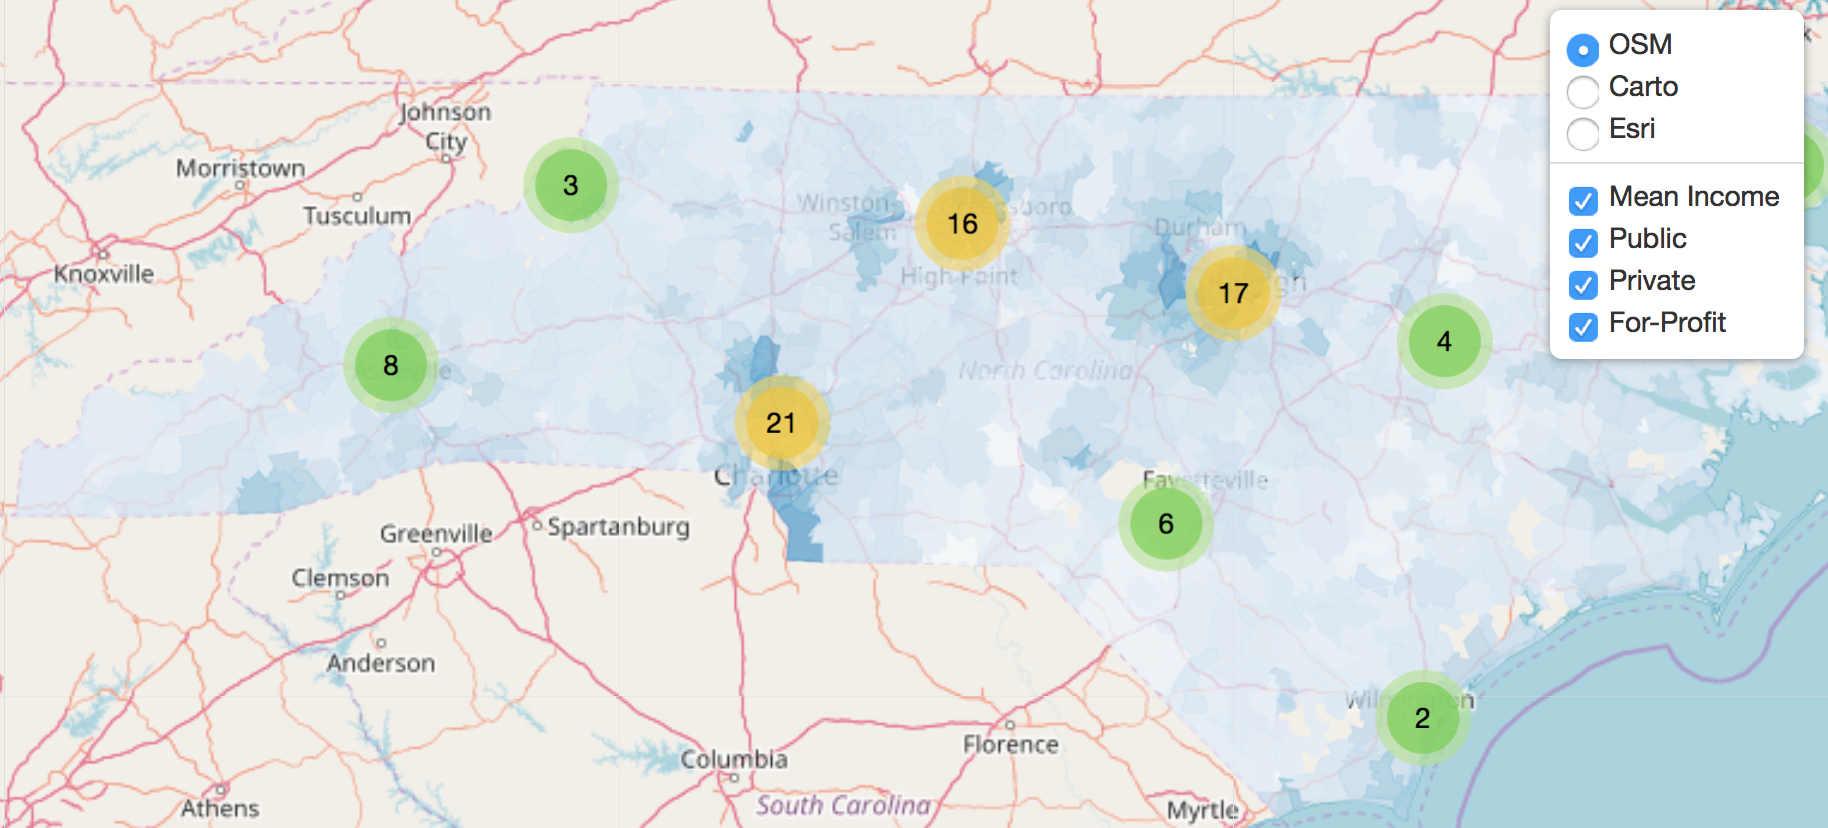
Bản đồ choropleth thu nhập đã log của NC 2

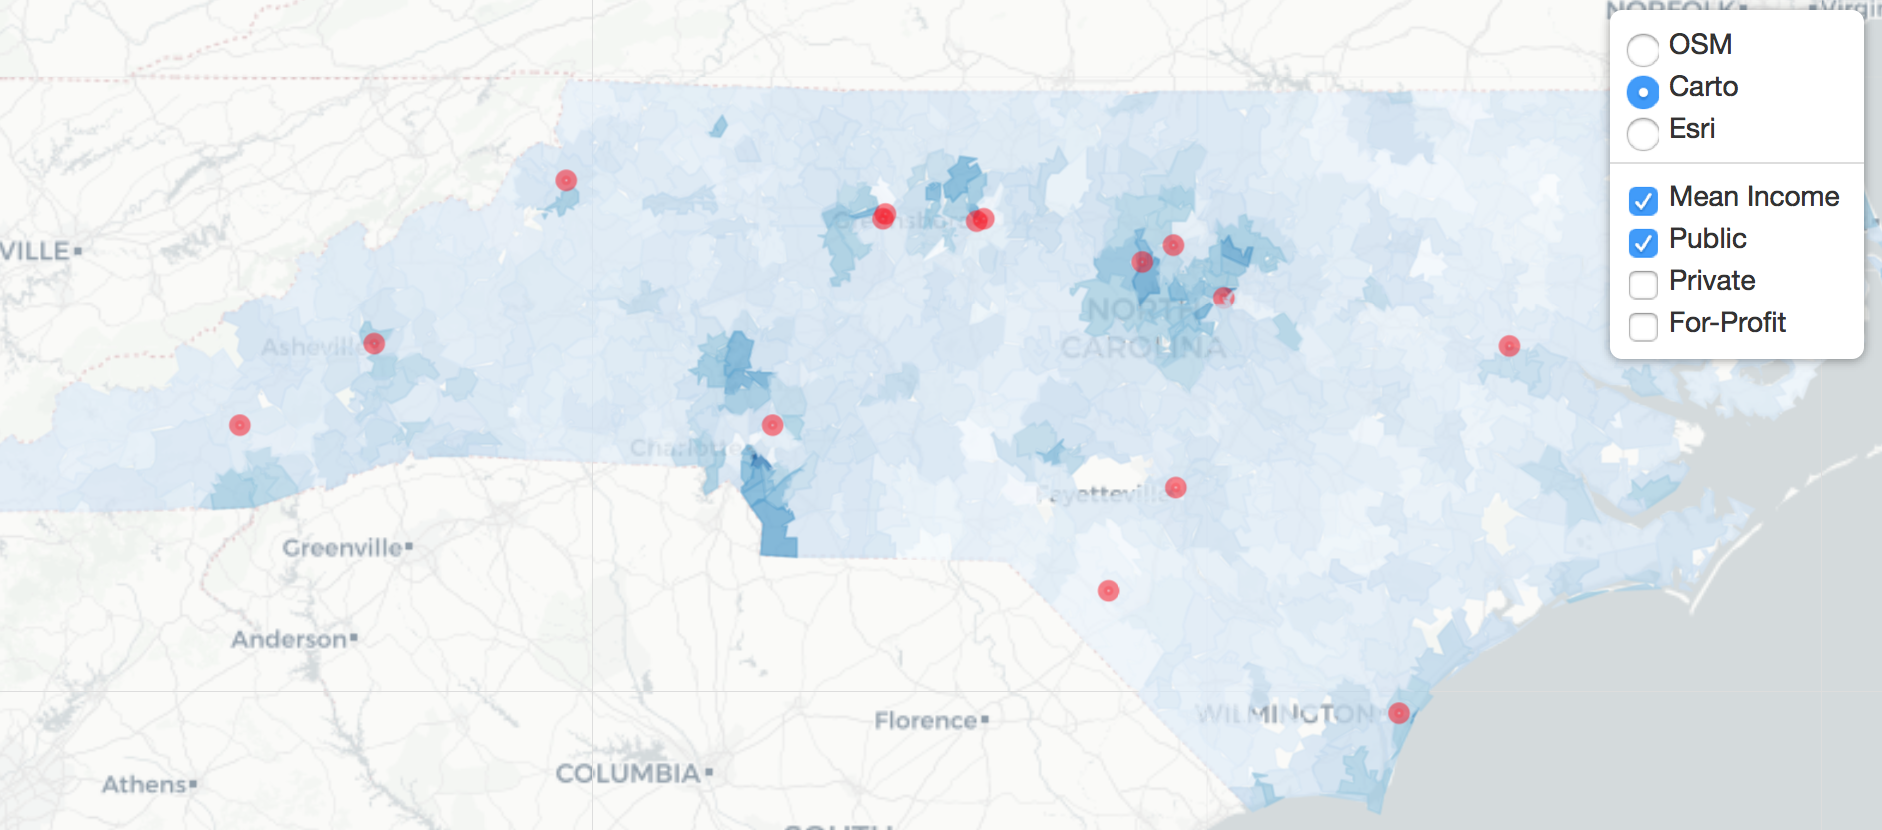
Bản đồ choropleth thu nhập đã log của NC 3

Bản đồ tương tác với leaflet trong R

Ghép tất cả lại với nhau

leaflet() %>% 
  addTiles(group = "OSM") %>% 
  addProviderTiles("CartoDB", group = "Carto") %>% 
  addProviderTiles("Esri", group = "Esri") %>%

addPolygons(data = shp, weight = 1, fillOpacity = .75, color = ~nc_pal(log(mean_income)), label = ~paste0("Mean Income: ", dollar(mean_income)), group = "Mean Income") %>%
Bản đồ tương tác với leaflet trong R

Ghép tất cả lại với nhau

  addCircleMarkers(data = nc_public, radius = 2, 
                   label = ~htmlEscape(name), 
                   color = ~pal(sector_label),group = "Public") %>% 
  addCircleMarkers(data = nc_private, radius = 2, 
                   label = ~htmlEscape(name),
                   color = ~pal(sector_label), group = "Private") %>% 
  addCircleMarkers(data = nc_profit, radius = 2, 
                   label = ~htmlEscape(name),
                   color = ~pal(sector_label),
                   group = "For-Profit") %>% 

addLayersControl(baseGroups = c("OSM", "Carto", "Esri"), overlayGroups = c("Public", "Private", "For-Profit", "Mean Income"))
Bản đồ tương tác với leaflet trong R

Ghép tất cả lại với nhau

Bản đồ choropleth thu nhập đã log của NC 4

Bản đồ tương tác với leaflet trong R

Lưu bản đồ

# Store leaflet map in object
m <- leaflet() %>% 
     addTiles() %>%
     addMarkers(data = ipeds,
                clusterOptions = markerClusterOptions()) %>% 
     addPolygons(data = shp)
# save leaflet object as html file
library(htmlwidgets)

saveWidget(m, file="myMap.html")
Bản đồ tương tác với leaflet trong R

Cùng luyện tập nào!

Bản đồ tương tác với leaflet trong R

Preparing Video For Download...