금융을 위한 중급 Python
Kennedy Behrman
Data Engineer, Author, Founder
exxon.head()
    Date         High        Volume      Month
0   2015-05-01   90.089996   198924100   May
1   2015-06-01   85.970001   238808600   Jun
2   2015-07-01   83.529999   274029000   Jul
3   2015-08-01   79.290001   387523600   Aug
4   2015-09-01   75.470001   316644500   Sep
my_dataframe.plot()
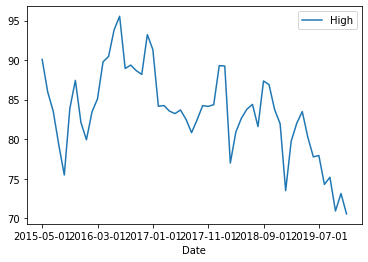
exxon.plot(x='Date',
           y='High' )
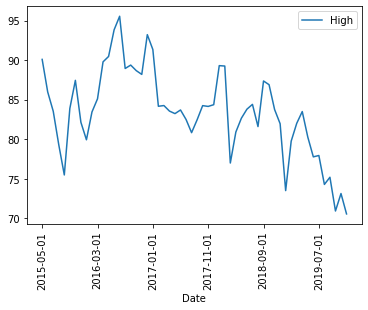
exxon.plot(x='Date',
           y='High',
           rot=90 )
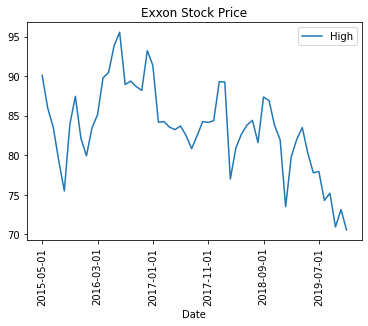
exxon.plot(x='Date',
           y='High',
           rot=90,
           title='Exxon Stock Price')
exxon.set_index('Date', inplace=True)
exxon.plot(y='High',
           rot=90,
           title='Exxon Stock Price')
line
bar
barh
hist
box
kde
density
area
pie
scatter
hexbin
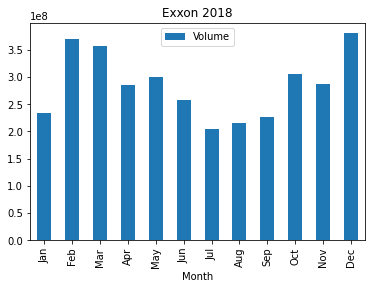
exxon2018.plot(x='Month',
               y='Volume',
               kind='bar',
               title='Exxon 2018')
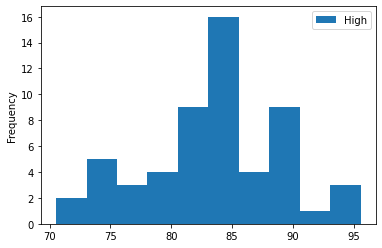
exxon.plot(y='High',kind='hist')