검정력 분석: 표본과 효과 크기

Python으로 배우는 실험 설계

James Chapman

Curriculum Manager, DataCamp

효과 크기 기초
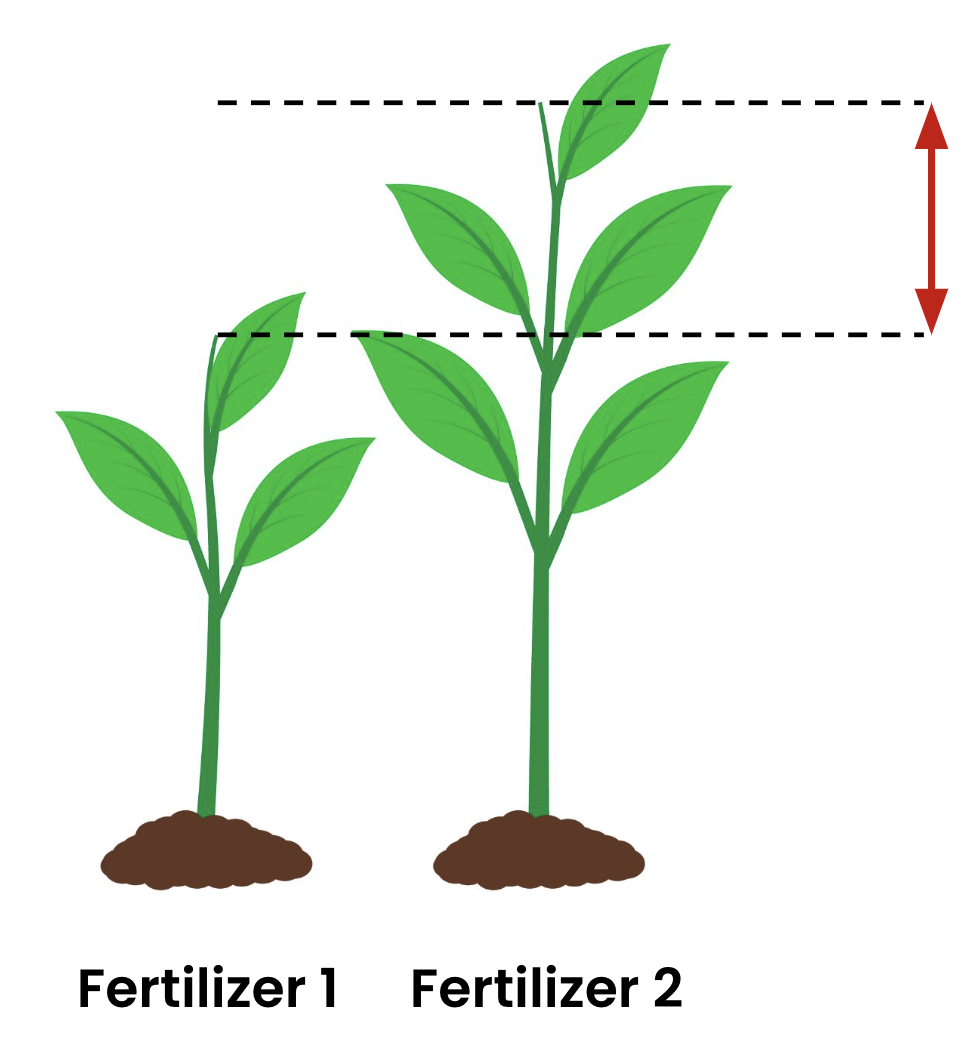
 

  • 효과 크기: 두 집단 간 차이를 정량화


  • Cohen’s d: 표준적인 효과 크기 지표

서로 다른 비료를 준 두 식물이 다른 높이로 자랐습니다. 높이 차이를 나타내는 화살표가 있어 효과 크기를 표현합니다.

Python으로 배우는 실험 설계

데이터셋: 비디오 게임 몰입도

  • 참가자 60명
    • 무작위 배정: 액션 30명
    • 무작위 배정: 퍼즐 30명
video_game_data.head()
   Game_Genre  Engagement_Time
0      Action              5.1
1      Puzzle              4.4
2      Action              7.2
3      Action              5.3
4      Puzzle              2.7
Python으로 배우는 실험 설계

검정력 계산 개요

  • 검정력: 거짓 영가설을 올바로 기각할 확률(1 − β)

    • 01 사이(진짜 효과를 검출할 자신도)
  • 과거 데이터에서 effect_size=1 가정

from statsmodels.stats.power import TTestIndPower
power_analysis = TTestIndPower()

power = power_analysis.solve_power(effect_size=1, nobs1=30, alpha=0.05) print(power)
0.9677082519951168
Python으로 배우는 실험 설계

Cohen’s d 공식

def cohens_d(group1, group2):

diff = group1.mean() - group2.mean() n1, n2 = len(group1), len(group2) var1, var2 = group1.var(), group2.var()
pooled_std = np.sqrt(((n1 - 1) * var1 + (n2 - 1) * var2) / (n1 + n2 - 2))
d = diff / pooled_std return d

풀링 표준편차: $\sigma_{p} = \sqrt{\frac{(n_1 - 1) \times \text{var}_1 + (n_2 - 1) \times \text{var}_2}{n_1 + n_2 - 2}}$

Python으로 배우는 실험 설계

비디오 게임 데이터의 Cohen’s d

action_times = video_game_data[video_game_data['Game_Genre'] == 'Action']['Engagement_Time']
puzzle_times = video_game_data[video_game_data['Game_Genre'] == 'Puzzle']['Engagement_Time']

d = cohens_d(action_times, puzzle_times) print(f"Cohen's d: {d}")
Cohen's d: 1.161524633221452
Python으로 배우는 실험 설계

표본 크기와 검정력 이해하기

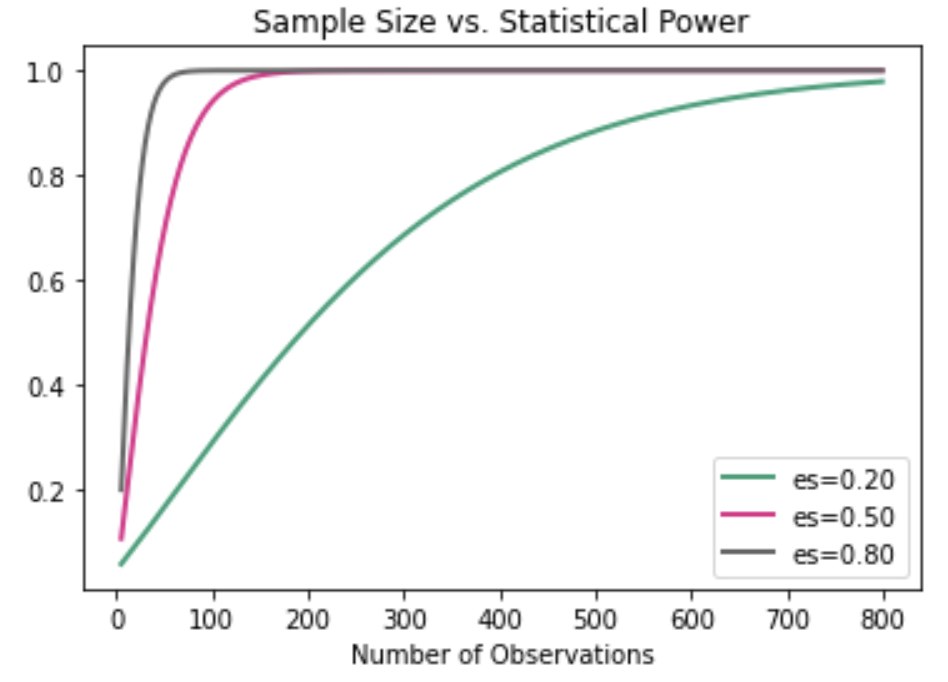
  • 검정력과 표본 크기 균형의 트레이드오프
  • 표본이 클수록 검정력 증가

표본 크기 vs. 검정력.png

1 https://grabngoinfo.com/power-analysis-for-sample-size-using-python/
Python으로 배우는 실험 설계

맥락에서의 표본 크기 계산

  • 반응 변수: engagement_time
from statsmodels.stats.power import TTestIndPower
power_analysis = TTestIndPower()
required_n = power_analysis.solve_power(effect_size=d, alpha=0.05, 
                                        power=0.99, ratio=1)
print(required_n)
28.237827708942007
Python으로 배우는 실험 설계

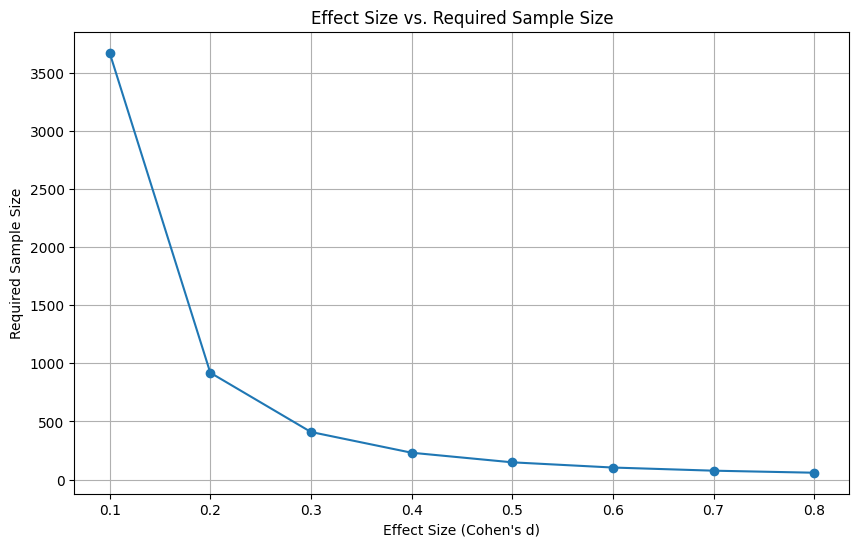
필요 표본 크기 시각화

import numpy as np
import matplotlib.pyplot as plt
effect_sizes = np.linspace(0.1, 0.8, 8)
sample_sizes = [power_analysis.solve_power(effect_size=es, alpha=0.05, power=0.99, 
                                           ratio=1) for es in effect_sizes]

plt.figure(figsize=(10, 6))
plt.plot(effect_sizes, sample_sizes, 'o-')
plt.title('Effect Size vs. Required Sample Size')
plt.xlabel('Effect Size (Cohen\'s d)')
plt.ylabel('Required Sample Size')
plt.grid(True)
plt.show()
Python으로 배우는 실험 설계

필요 표본 크기 시각화

효과 크기 vs. 필요 표본 크기.png

Python으로 배우는 실험 설계

연습해 봅시다!

Python으로 배우는 실험 설계

Preparing Video For Download...