R로 하는 가설 검정
Richie Cotton
Data Evangelist at DataCamp
library(infer)
stack_overflow %>%
prop_test(
hobbyist ~ age_cat,
order = c("At least 30", "Under 30"),
alternative = "two-sided",
correct = FALSE
)
# A tibble: 1 x 6
statistic chisq_df p_value alternative lower_ci upper_ci
<dbl> <dbl> <dbl> <chr> <dbl> <dbl>
1 17.8 1 0.0000248 two.sided 0.0605 0.165
이전 가설 검정 결과: hobbyist와 age_cat 변수 간에 연관성이 있다는 증거가 있습니다.
반응 변수의 성공 비율이 설명 변수의 모든 범주에 걸쳐 동일하면, 두 변수는 통계적으로 독립입니다.
stack_overflow %>%
count(age_cat)
# A tibble: 2 x 2
age_cat n
<chr> <int>
1 At least 30 1050
2 Under 30 1211
stack_overflow %>%
count(job_sat)
# A tibble: 5 x 2
job_sat n
<fct> <int>
1 Very dissatisfied 159
2 Slightly dissatisfied 342
3 Neither 201
4 Slightly satisfied 680
5 Very satisfied 879
$H_{0}$: 연령 범주는 직업 만족도 수준과 독립입니다.
$H_{A}$: 연령 범주는 직업 만족도 수준과 독립이 아닙니다.
alpha <- 0.1
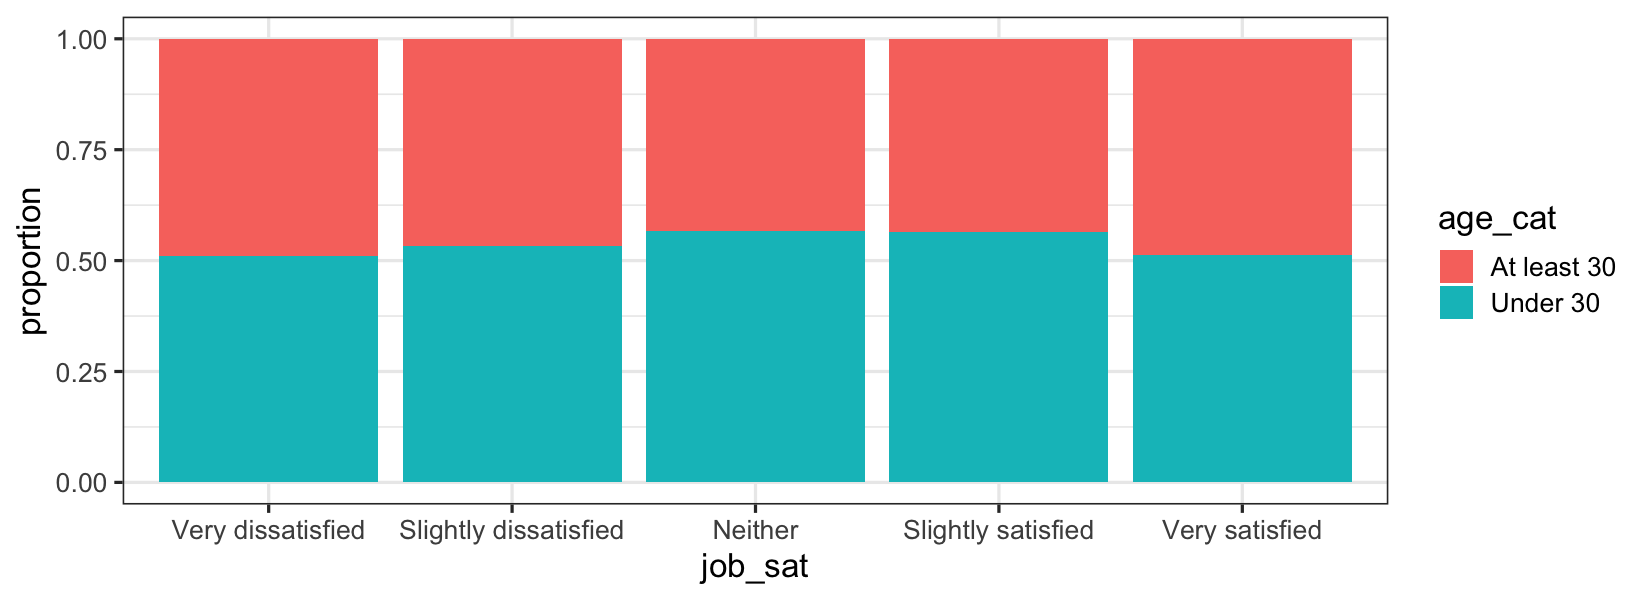
ggplot(stack_overflow, aes(job_sat, fill = age_cat)) +
geom_bar(position = "fill") +
ylab("proportion")
library(infer)
stack_overflow %>%
chisq_test(age_cat ~ job_sat)
# A tibble: 1 x 3
statistic chisq_df p_value
<dbl> <int> <dbl>
1 5.55 4 0.235
자유도:
$(\text{반응 범주 수} - 1) \times (\text{설명 범주 수} - 1)$
$(2 - 1) * (5 - 1) = 4$
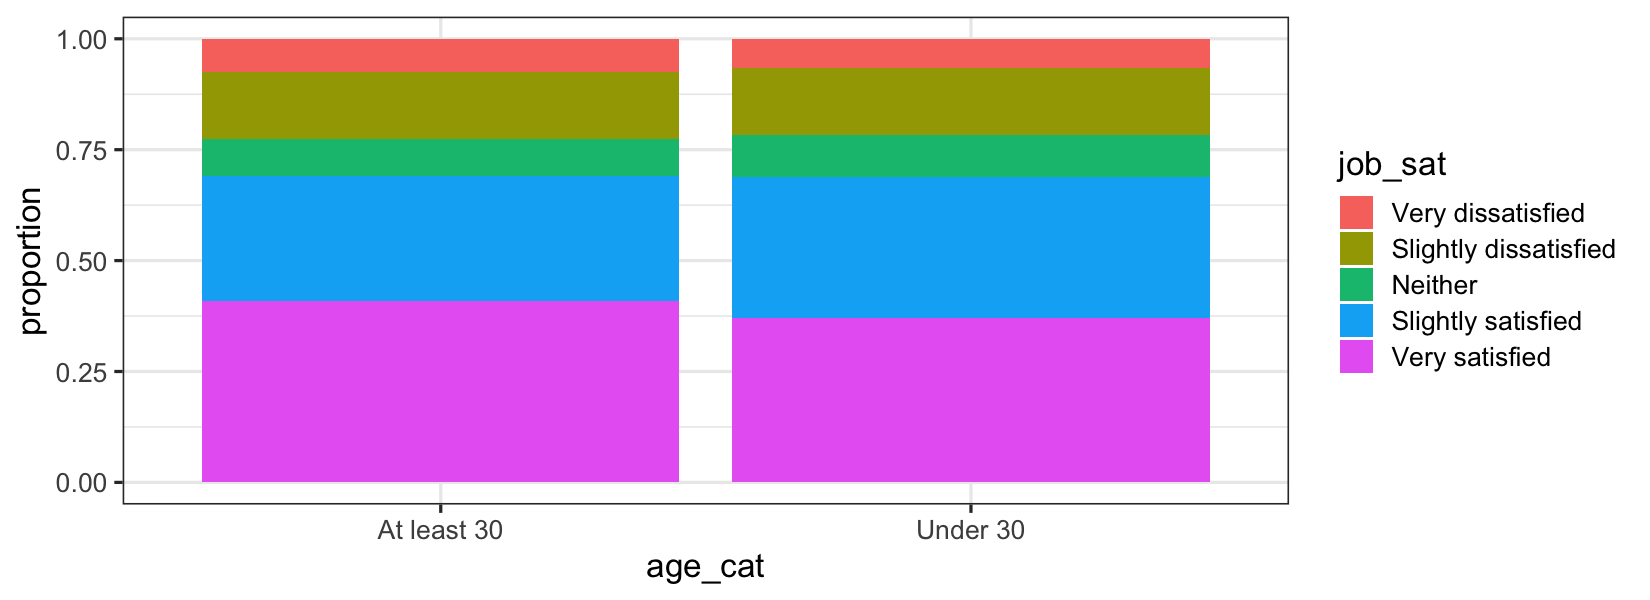
ggplot(stack_overflow, aes(age_cat, fill = job_sat)) +
geom_bar(position = "fill") +
ylab("proportion")
library(infer)
stack_overflow %>%
chisq_test(age_cat ~ job_sat)
# A tibble: 1 x 3
statistic chisq_df p_value
<dbl> <int> <dbl>
1 5.55 4 0.235
질문
변수 X와 Y는 독립인가?
library(infer)
stack_overflow %>%
chisq_test(job_sat ~ age_cat)
# A tibble: 1 x 3
statistic chisq_df p_value
<dbl> <int> <dbl>
1 5.55 4 0.235
아님
변수 X는 변수 Y로부터 독립인가?
args(chisq_test)
function (x, formula, response = NULL, explanatory = NULL, ...)
R로 하는 가설 검정