Permutation 중요도
Python으로 배우는 Explainable AI

Fouad Trad
Machine Learning Engineer
셔플로 악기 중요도 알아보기

Permutation 중요도
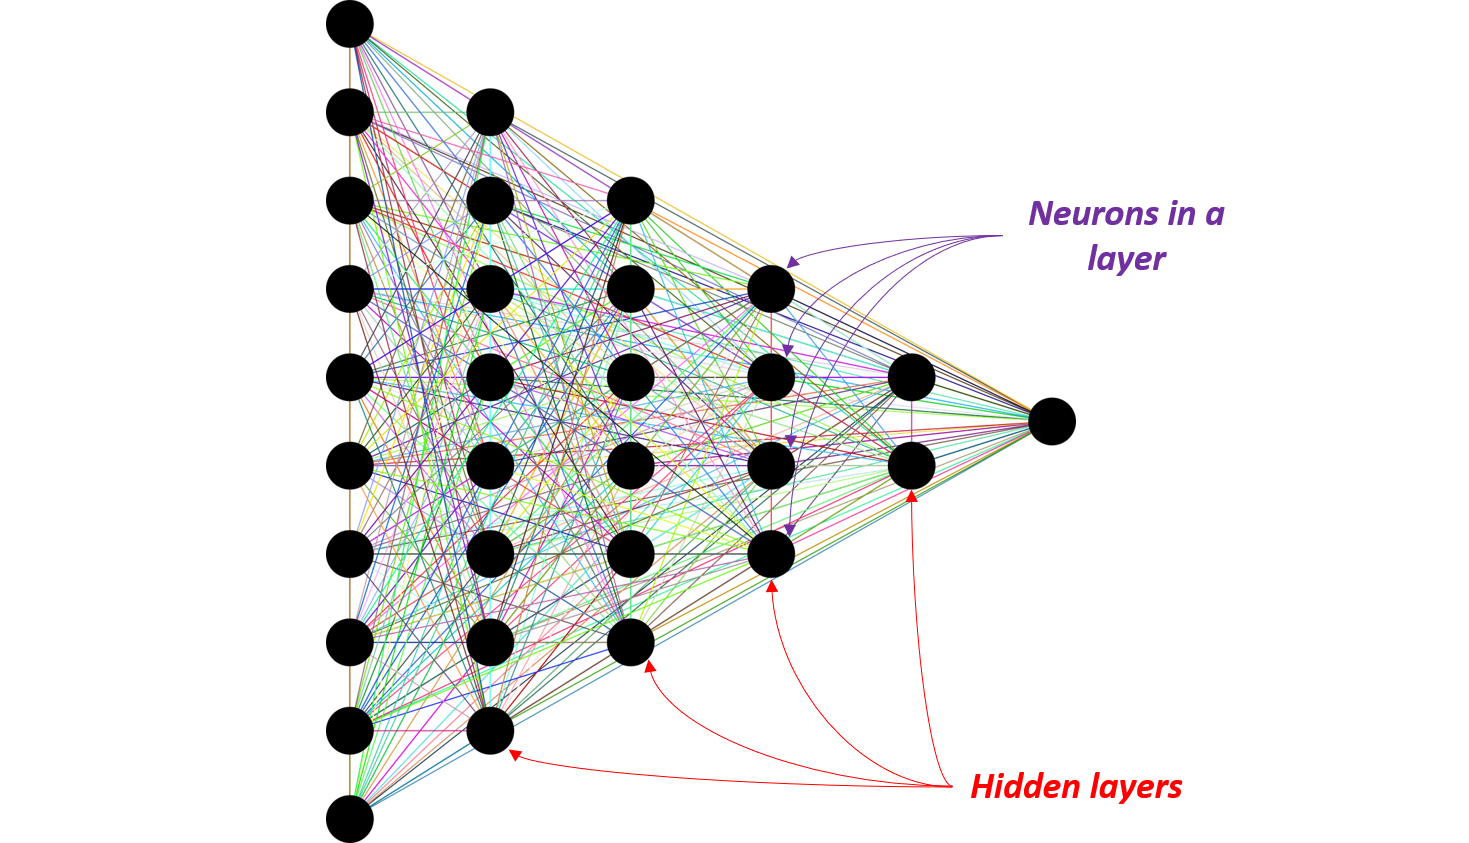
Permutation 중요도 실습
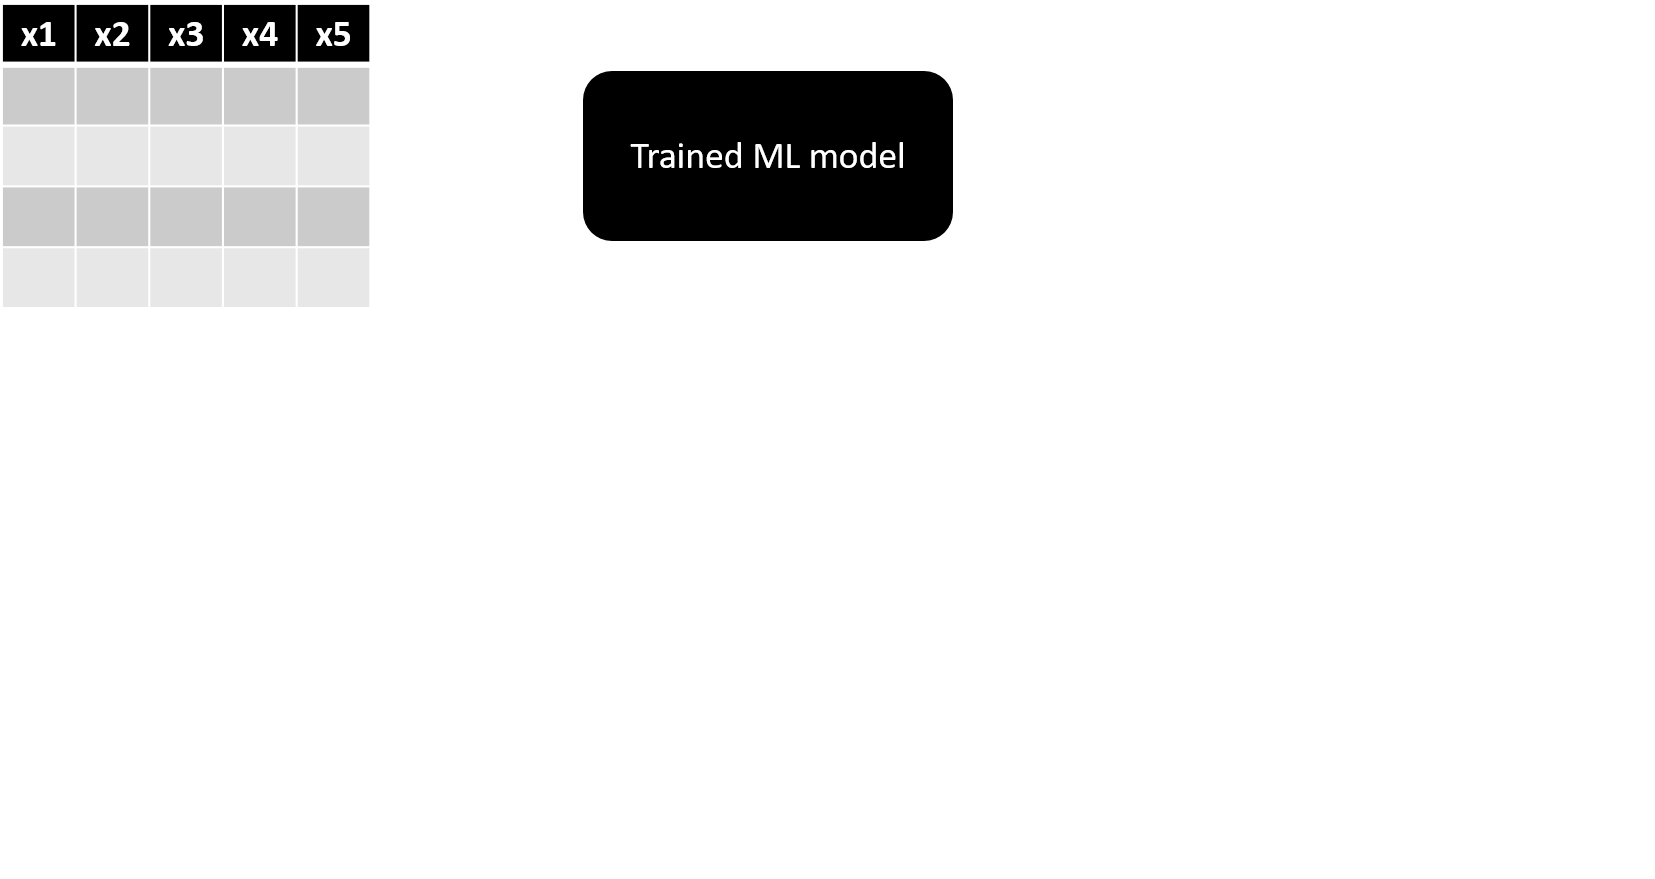
Permutation 중요도 실습
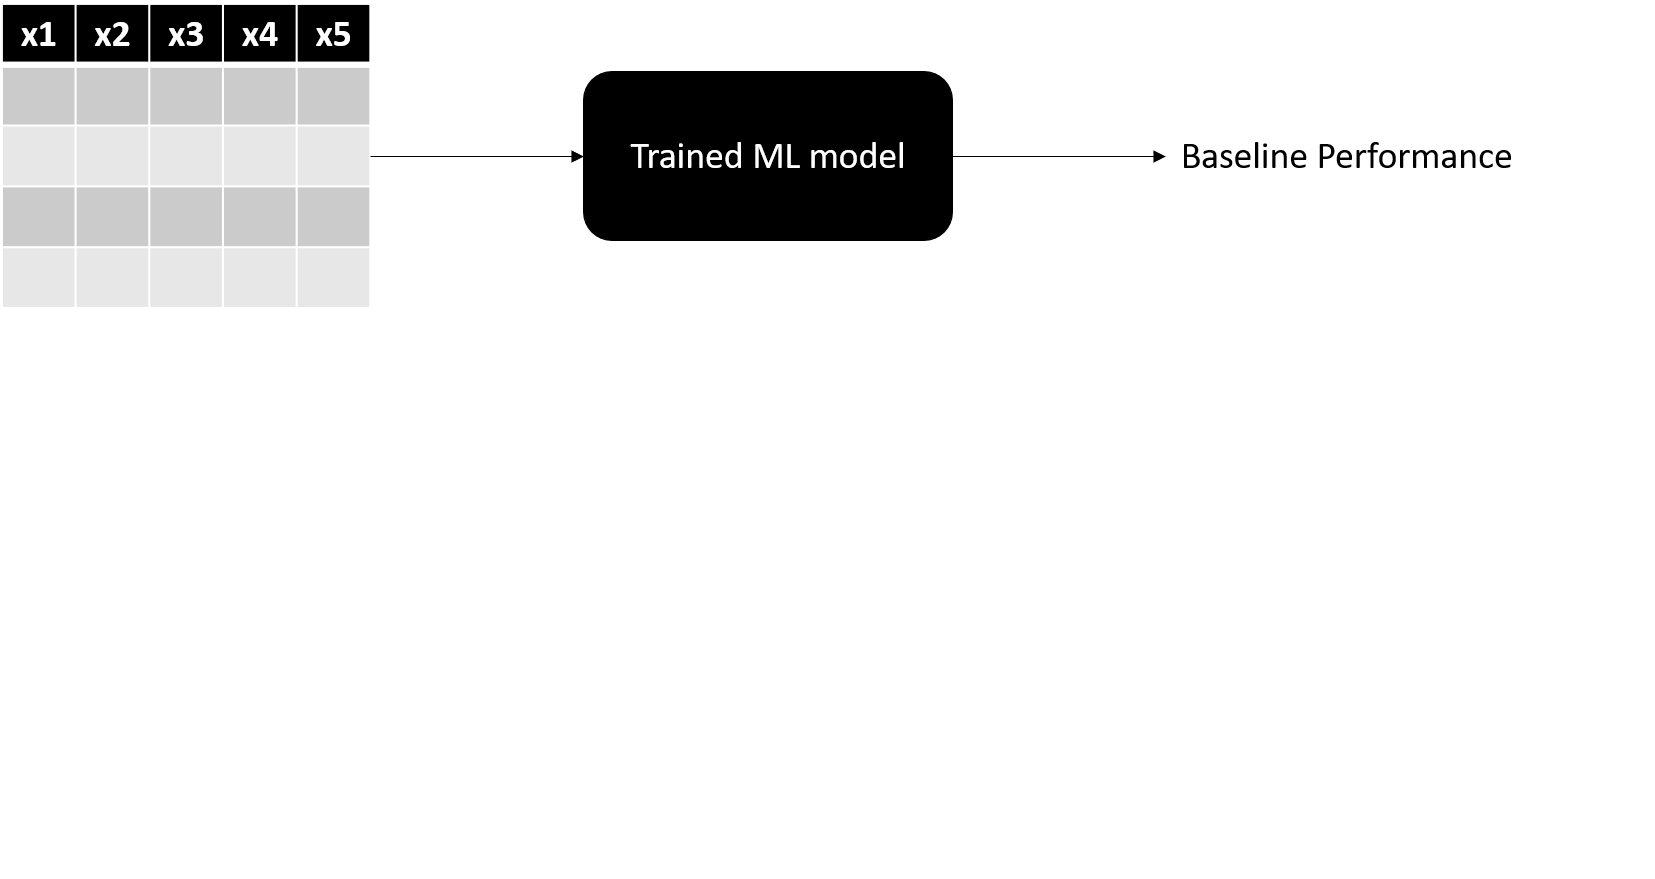
Permutation 중요도 실습
![원본 데이터셋에서 한 특성의 값이 [1, 2, 3, 4]였고 셔플 후 [4, 2, 1, 3]으로 바뀌는 모습을 보여주는 이미지. 셔플된 데이터셋을 ML 모델에 넣어 셔플 후 성능을 얻습니다.](https://assets.datacamp.com/production/repositories/6745/datasets/8941afd8450944dd95675cf114c800a0de3d511c/PI_2.png)
Permutation 중요도 실습
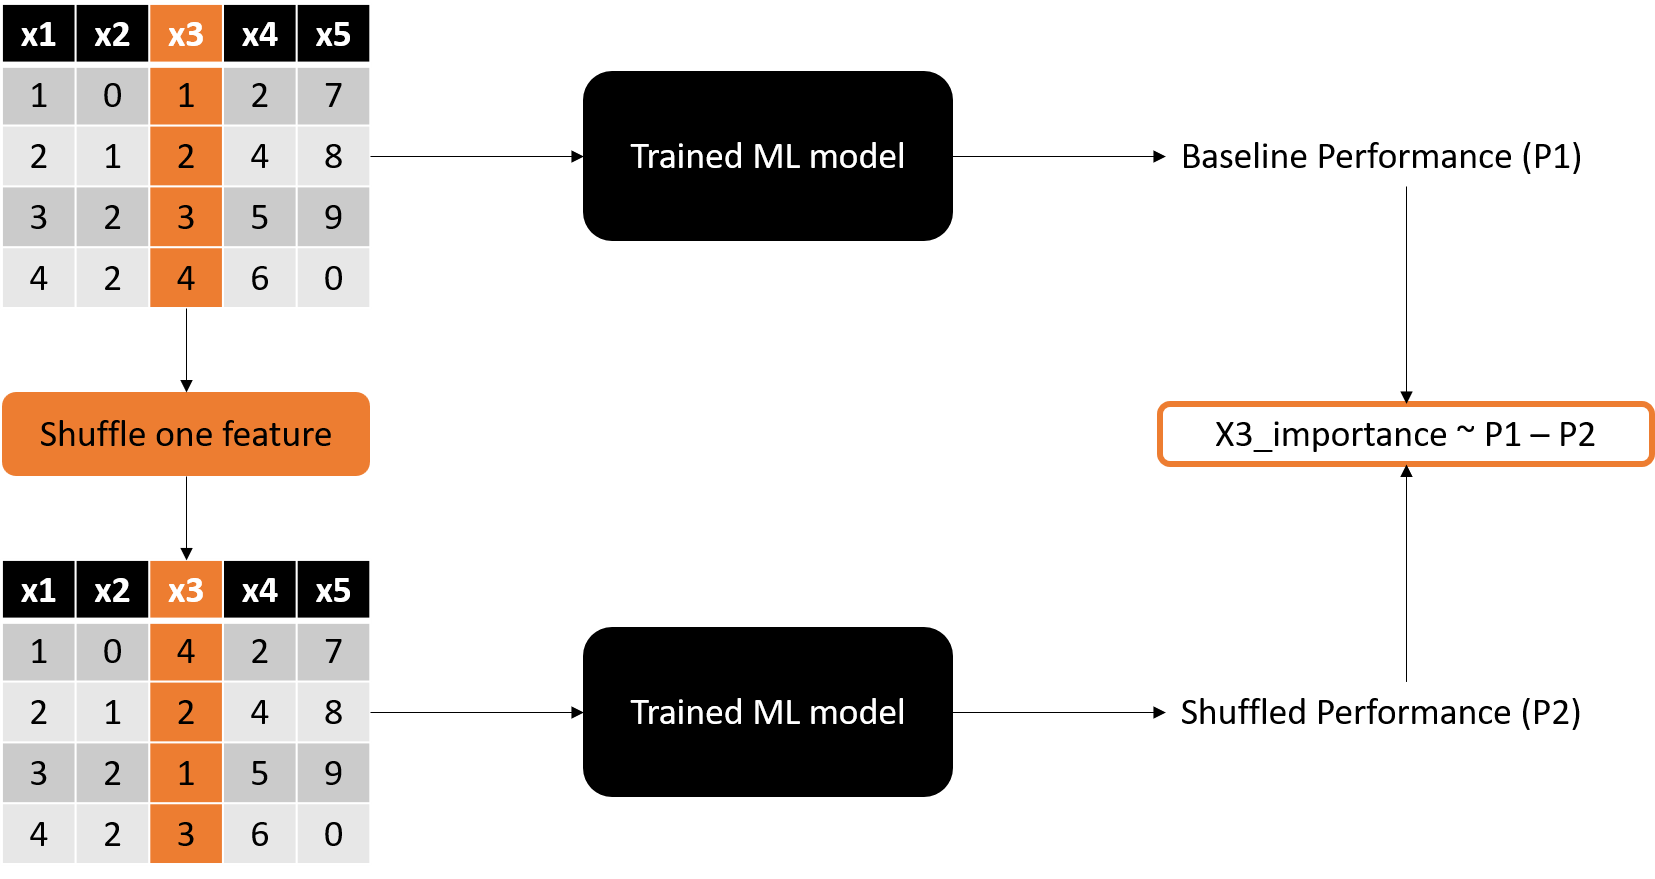
Permutation 중요도 실습
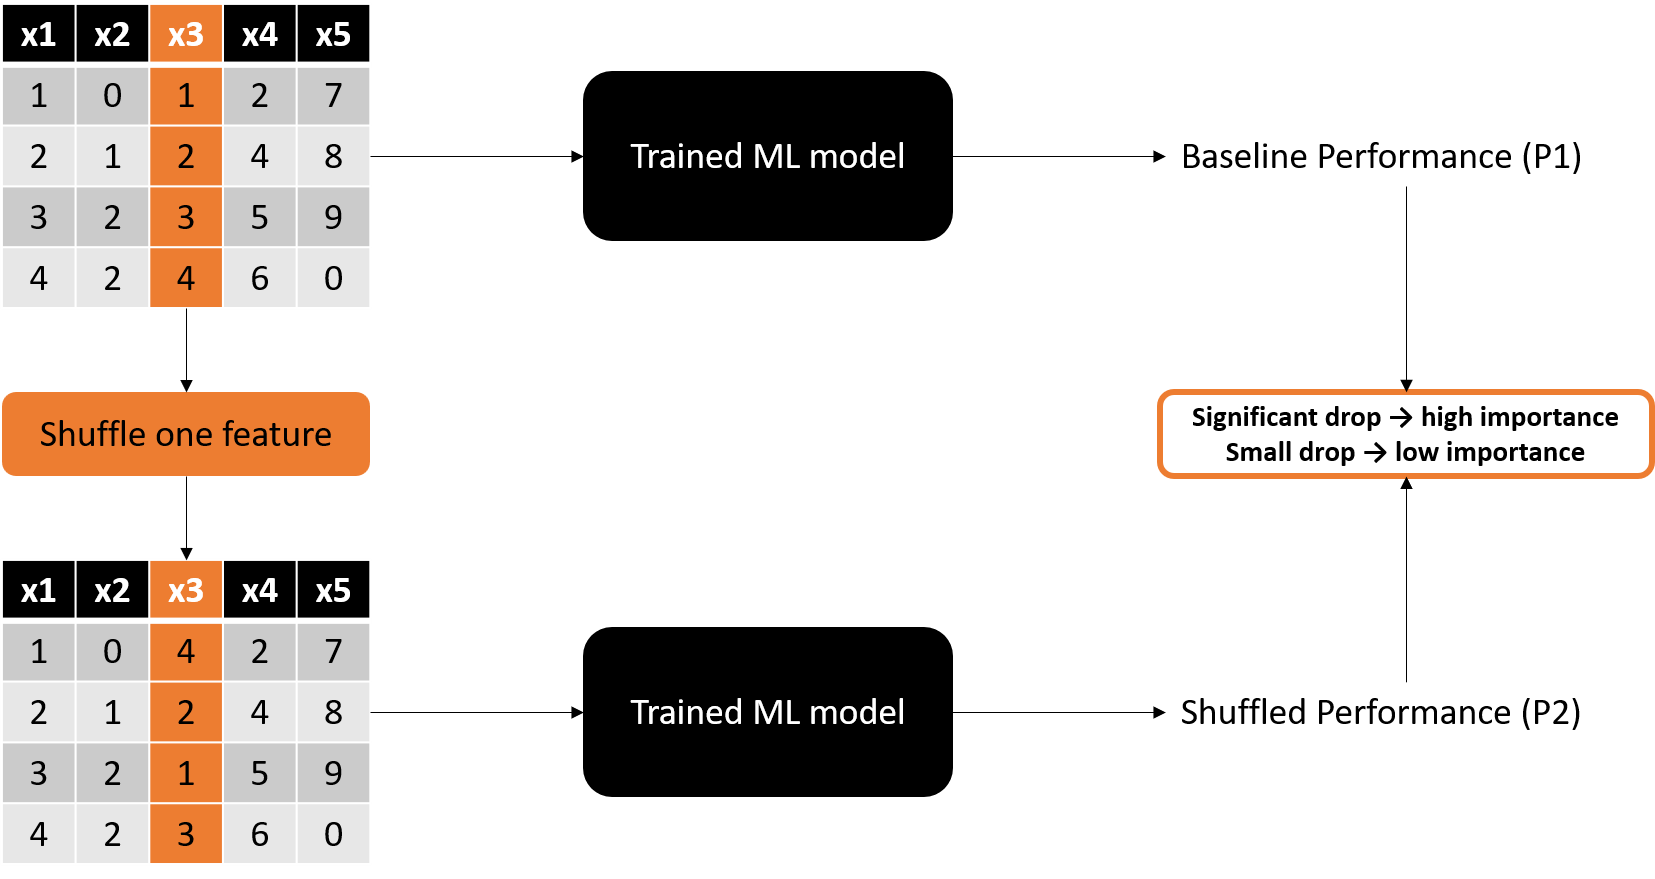
중요도 시각화
import matplotlib.pyplot as plt
plt.bar(X_train.columns,
        result.importances_mean)
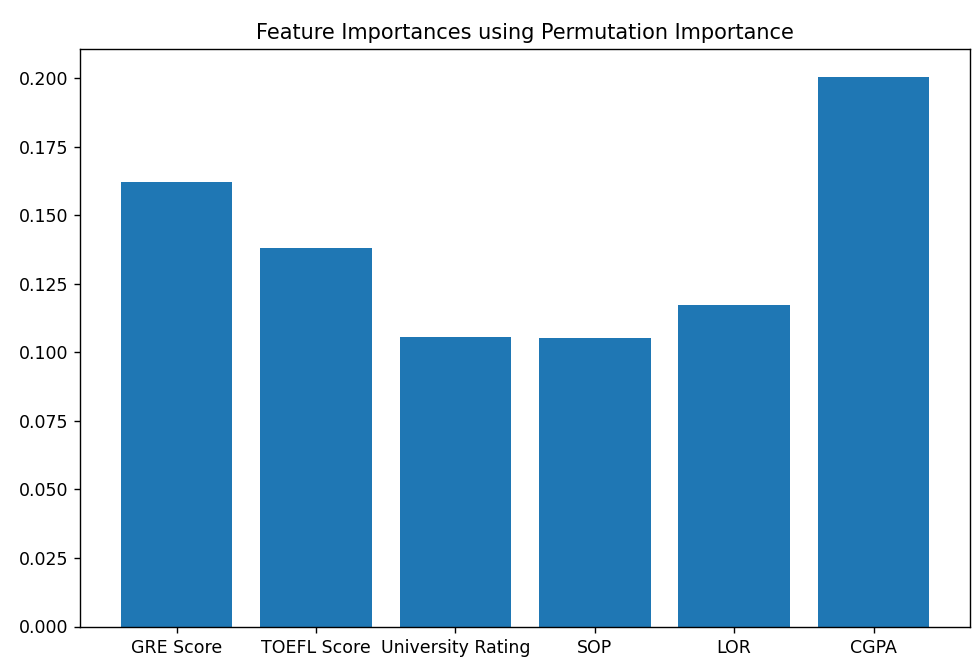
모델별 접근법과 비교
import matplotlib.pyplot as plt
plt.bar(X_train.columns,
        result.importances_mean)
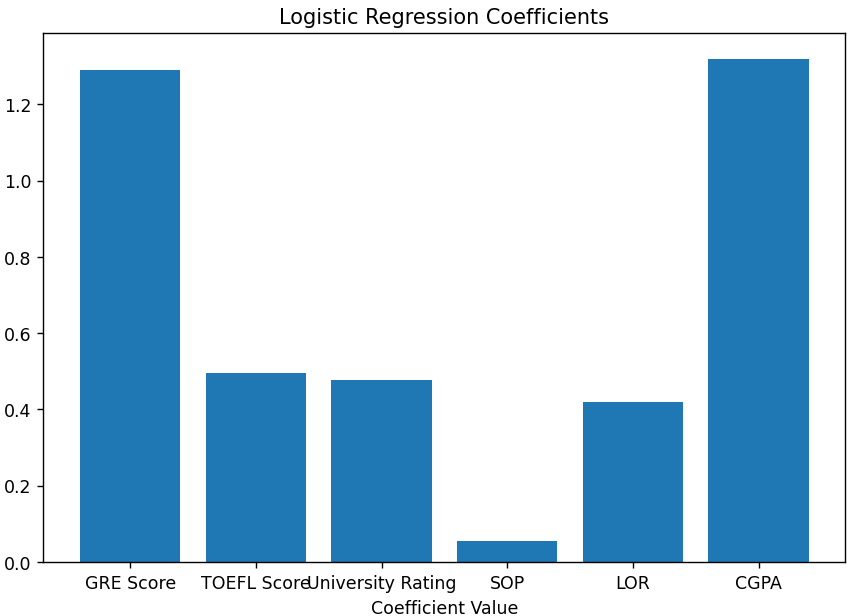
로지스틱 회귀
plt.bar(X_train.columns, np.abs(log_reg.coef_[0]))