설명 가능성 지표

Python으로 배우는 Explainable AI

Fouad Trad

Machine Learning Engineer

일관성

  • 다른 부분집합으로 학습해도 설명의 안정성을 평가
  • 낮은 일관성 → 설명이 견고하지 않음

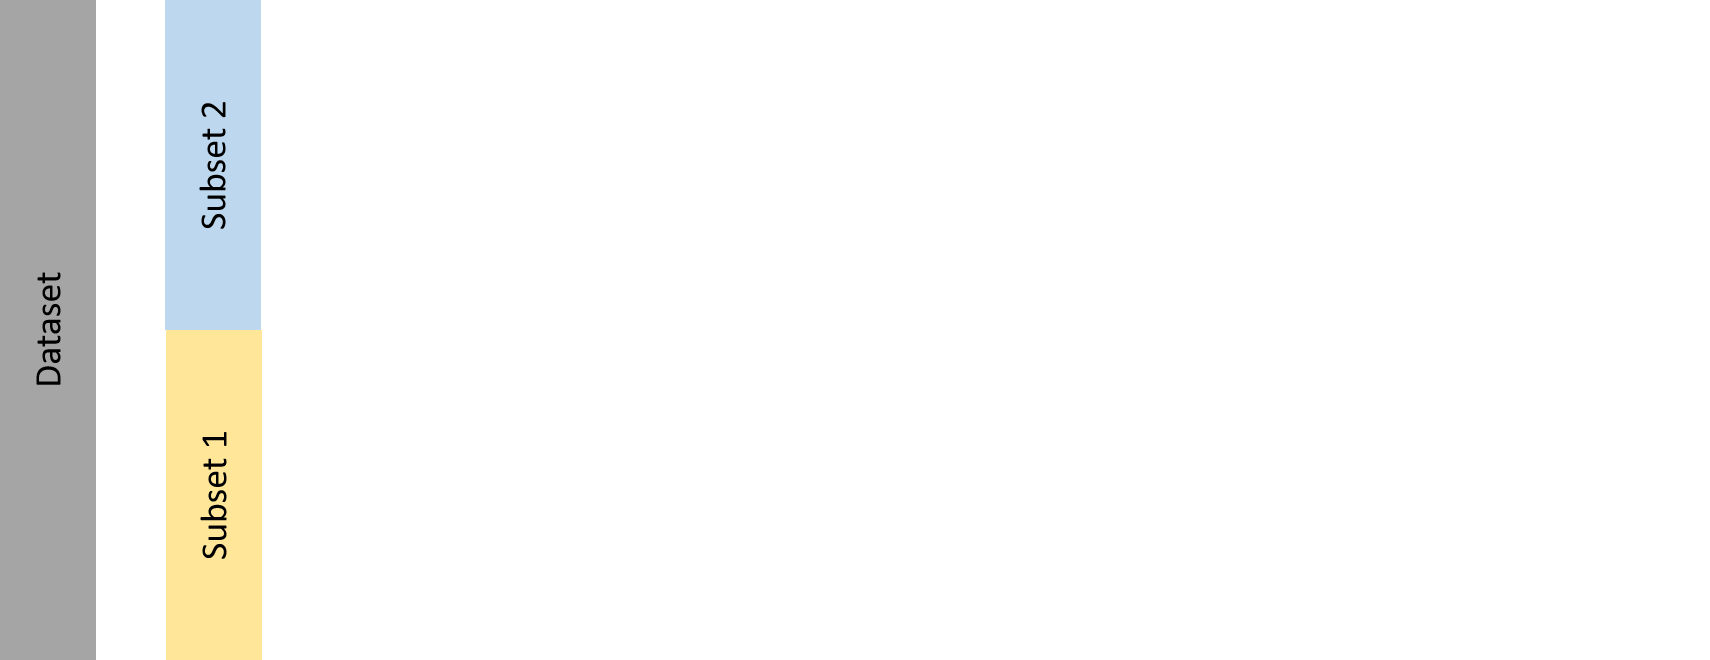
데이터셋을 두 부분집합으로 나눈 이미지: 부분집합 1, 부분집합 2.

Python으로 배우는 Explainable AI

일관성

  • 다른 부분집합으로 학습해도 설명의 안정성을 평가
  • 낮은 일관성 → 설명이 견고하지 않음

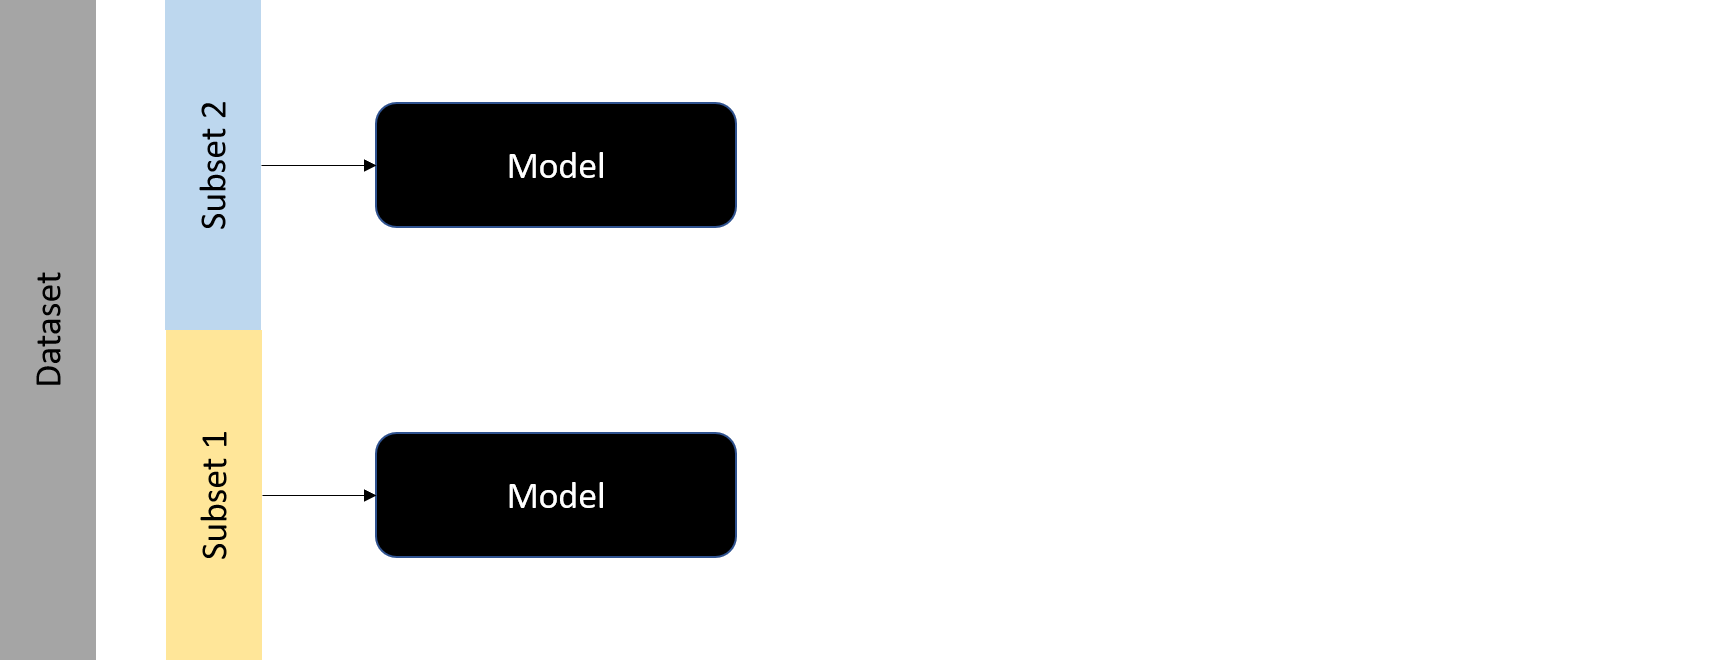
각 부분집합으로 모델을 학습.

Python으로 배우는 Explainable AI

일관성

  • 다른 부분집합으로 학습해도 설명의 안정성을 평가
  • 낮은 일관성 → 설명이 견고하지 않음

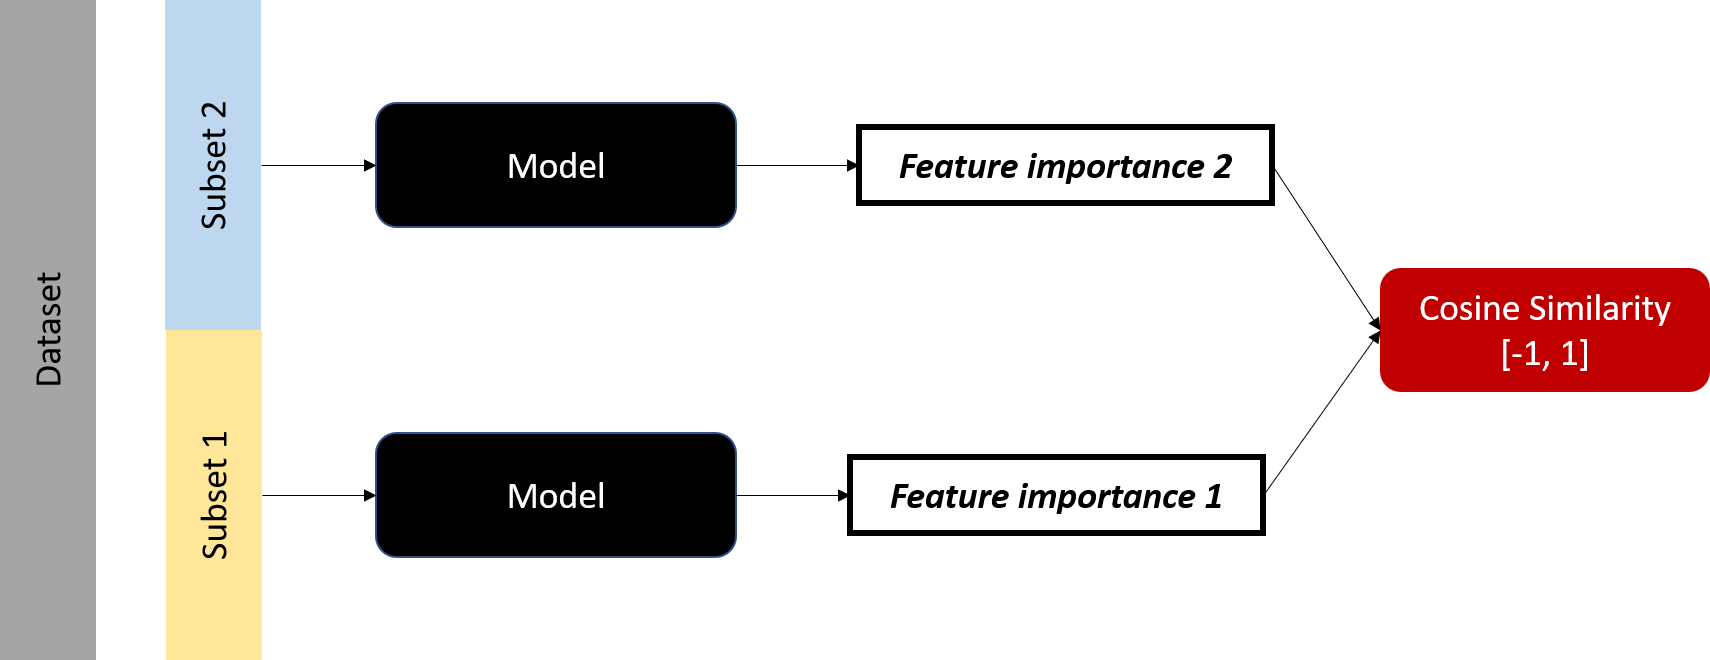
각 부분집합으로 모델을 학습할 때마다 특성 중요도를 산출하고, 이에 대해 코사인 유사도를 계산.

Python으로 배우는 Explainable AI

코사인 유사도로 일관성 측정


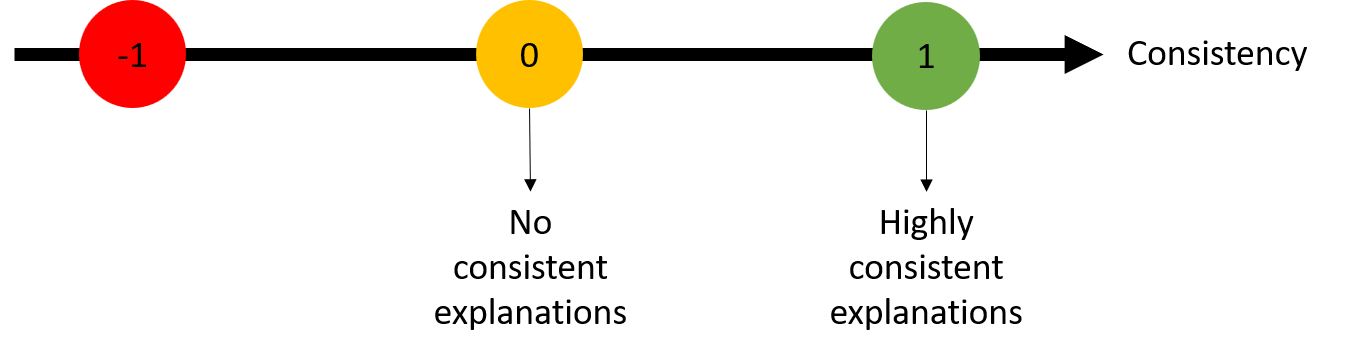
일관성 핵심 값과 의미: 1은 매우 일관된 설명.

Python으로 배우는 Explainable AI

코사인 유사도로 일관성 측정


일관성 핵심 값과 의미: 1은 매우 일관된 설명, 0은 일관성 없음.

Python으로 배우는 Explainable AI

코사인 유사도로 일관성 측정


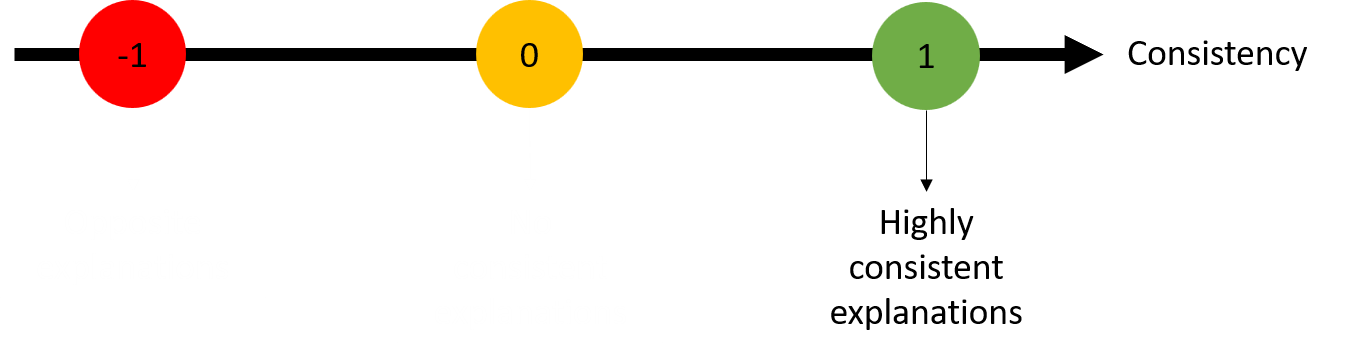
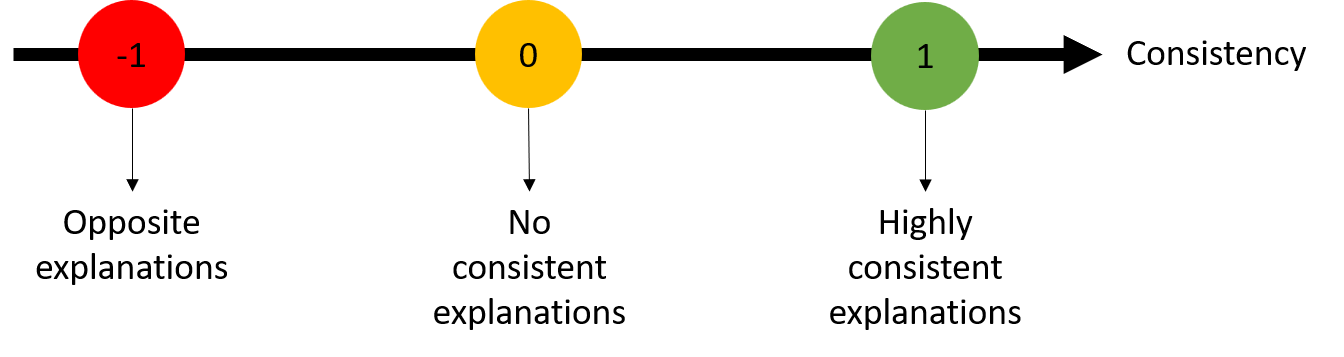
일관성 핵심 값과 의미를 보여주는 이미지: 1은 매우 일관된 설명, 0은 일관성 없음, -1은 반대 설명.

Python으로 배우는 Explainable AI

입학 데이터셋

GRE 점수 TOEFL 점수 대학 등급 SOP LOR CGPA 합격 가능성
337 118 4 4.5 4.5 9.65 0.92
324 107 4 4 4.5 8.87 0.76
316 104 3 3 3.5 8 0.72
322 110 3 3.5 2.5 8.67 0.8
314 103 2 2 3 8.21 0.45


  • X1, y1: 데이터셋 1부
  • X2, y2: 데이터셋 2부
  • model1, model2: 랜덤 포레스트 회귀기
Python으로 배우는 Explainable AI

일관성 계산하기

from sklearn.metrics.pairwise import cosine_similarity

explainer1 = shap.TreeExplainer(model1) explainer2 = shap.TreeExplainer(model2)
shap_values1 = explainer1.shap_values(X1) shap_values2 = explainer2.shap_values(X2)
feature_importance1 = np.mean(np.abs(shap_values1), axis=0) feature_importance2 = np.mean(np.abs(shap_values2), axis=0)
consistency = cosine_similarity([feature_importance1], [feature_importance2]) print("Consistency between SHAP values:", consistency)
Consistency between SHAP values: [[0.99706516]]
Python으로 배우는 Explainable AI

충실도

  • 중요한 특성이 예측에 영향을 주는지 평가
  • 낮은 충실도 → 모델 추론에 대한 신뢰를 흐림
  • 민감한 분야에 유용

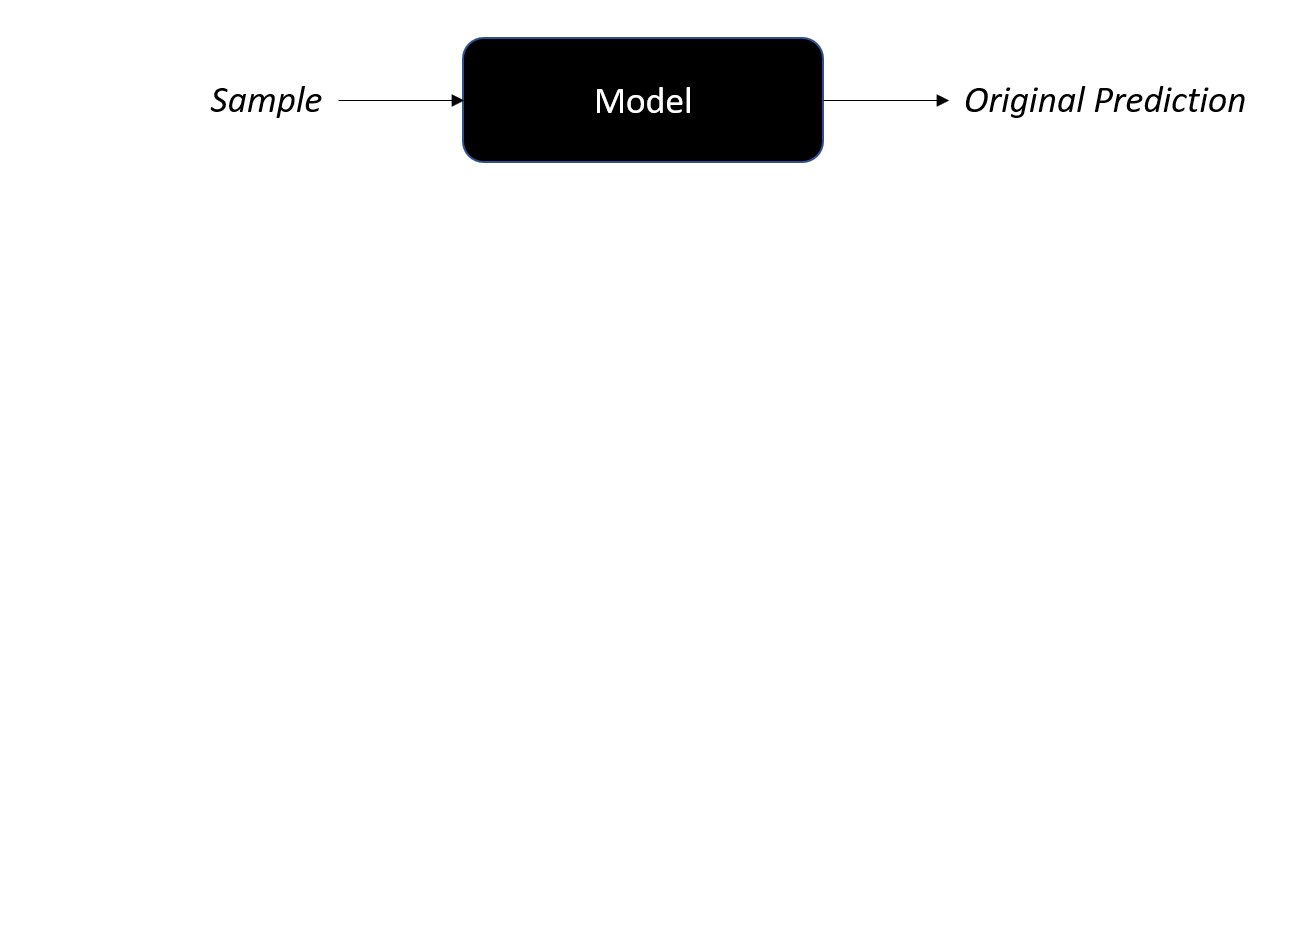
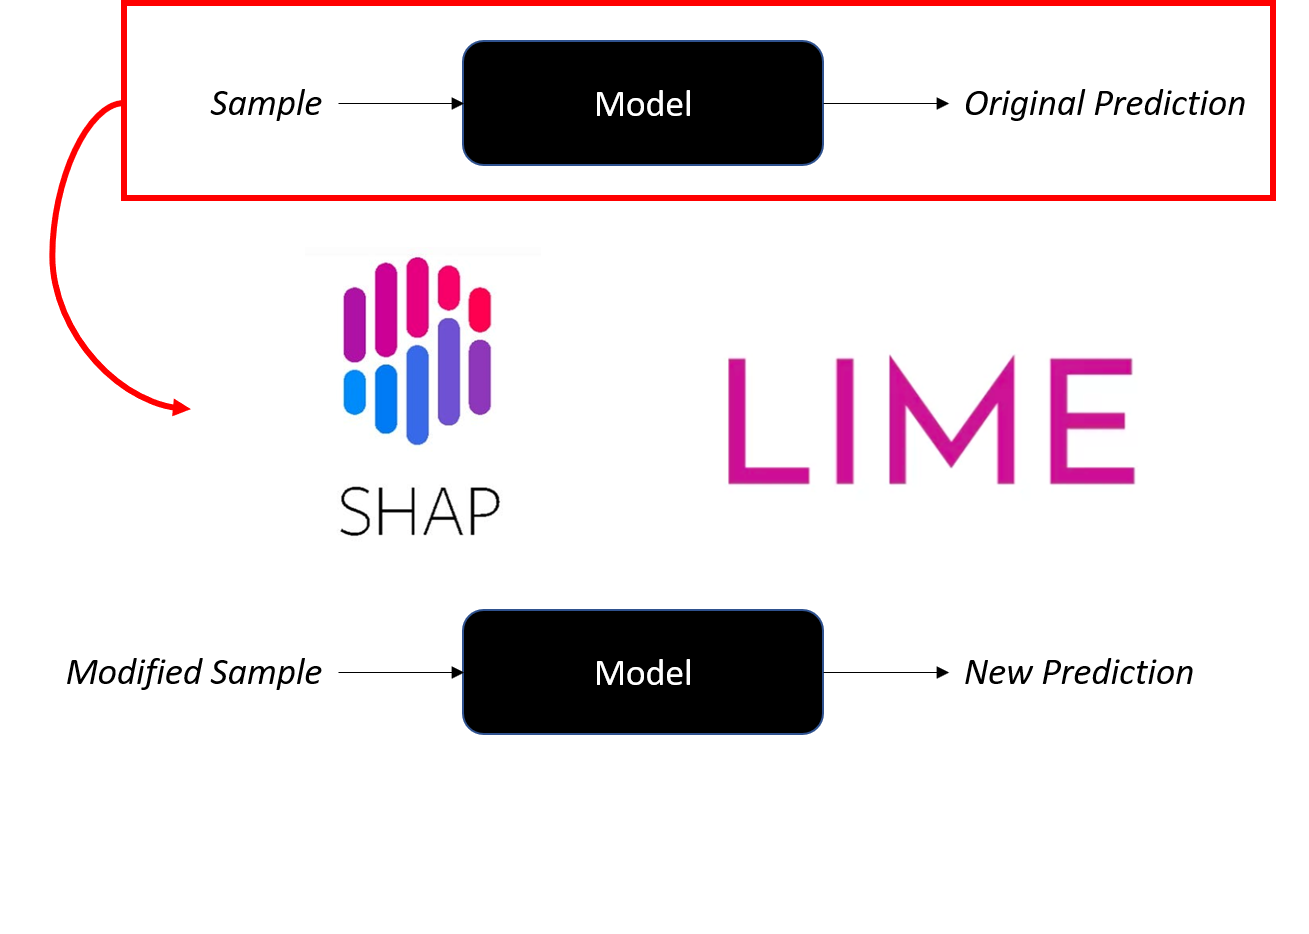
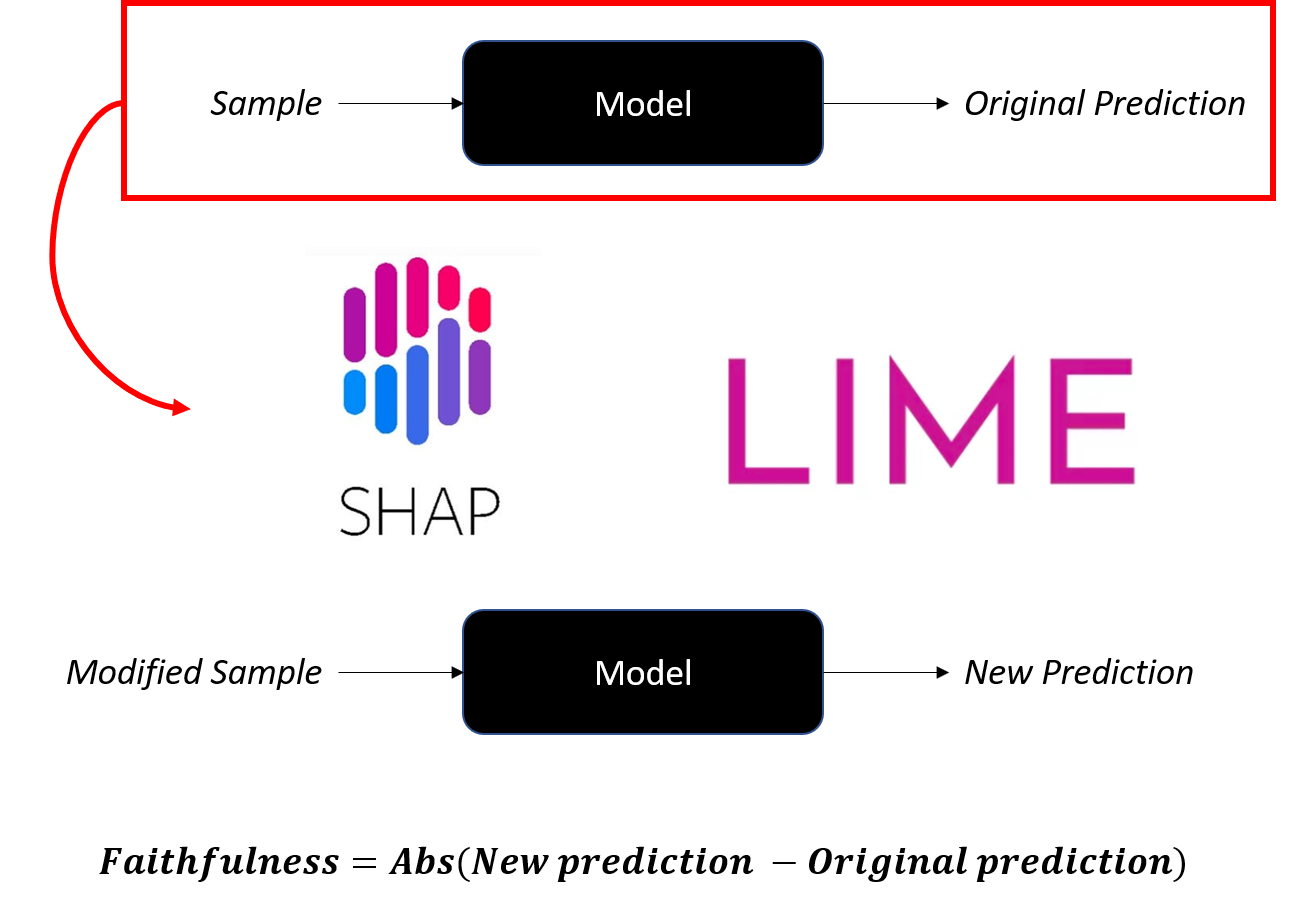
입력 샘플에 대한 모델의 원래 예측을 보여주는 이미지.

Python으로 배우는 Explainable AI

충실도

  • 중요한 특성이 예측에 영향을 주는지 평가
  • 낮은 충실도 → 모델 추론에 대한 신뢰를 흐림
  • 민감한 분야에 유용

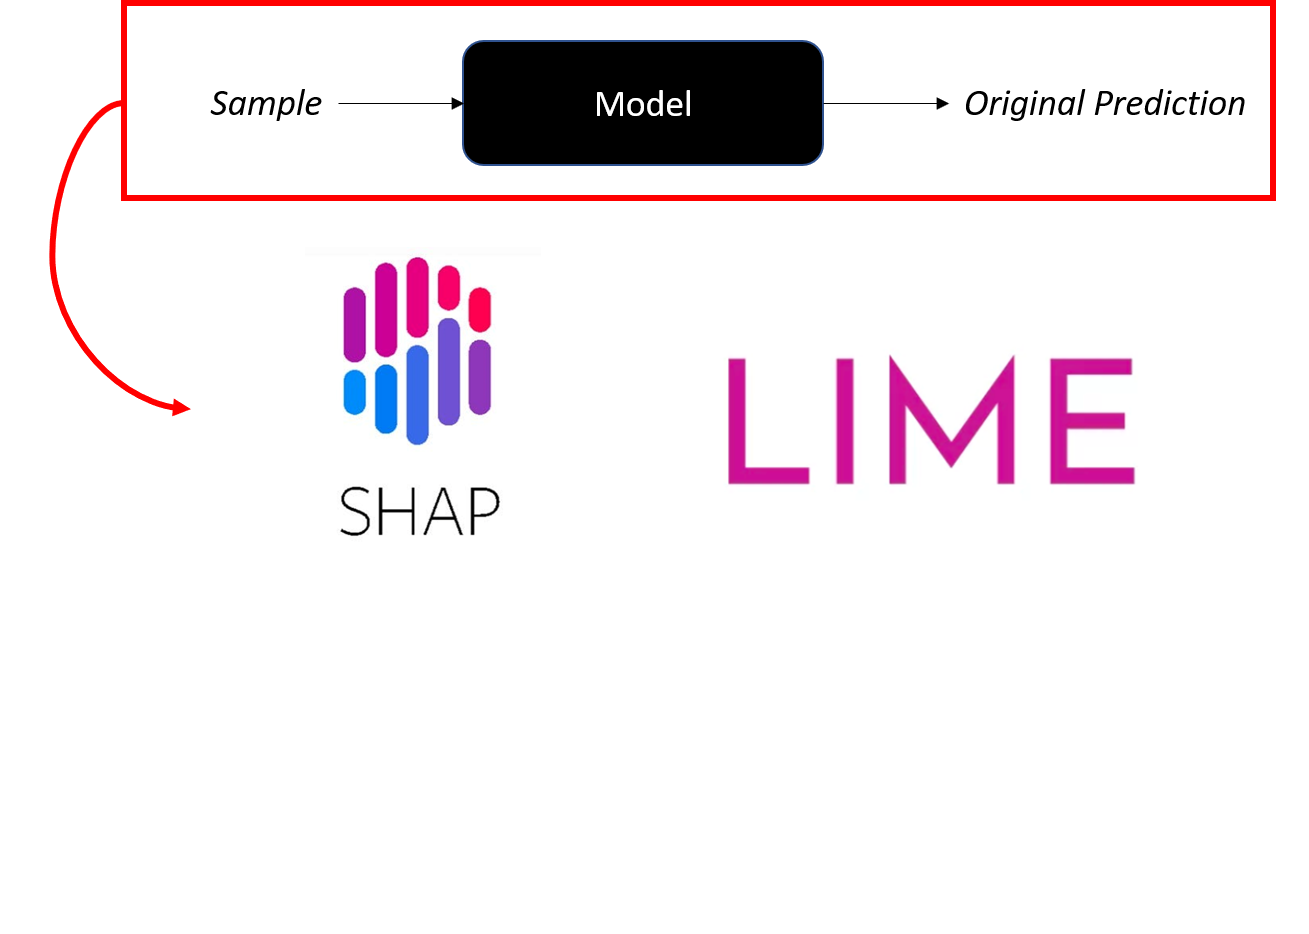
SHAP 또는 LIME으로 이 원래 예측을 국소적으로 설명.

Python으로 배우는 Explainable AI

충실도

  • 중요한 특성이 예측에 영향을 주는지 평가
  • 낮은 충실도 → 모델 추론에 대한 신뢰를 흐림
  • 민감한 분야에 유용

수정된 샘플을 모델에 넣어 새로운 예측을 생성.

Python으로 배우는 Explainable AI

충실도

  • 중요한 특성이 예측에 영향을 주는지 평가
  • 낮은 충실도 → 모델 추론에 대한 신뢰를 흐림
  • 민감한 분야에 유용

새 예측과 원래 예측의 차이 절댓값으로 충실도를 계산하는 공식을 보여주는 이미지.

Python으로 배우는 Explainable AI

충실도 계산하기

X_instance = X_test.iloc[[0]]

original_prediction = model.predict_proba(X_instance)[0, 1] print(f"Original prediction: {original_prediction}")
Original prediction: 0.43
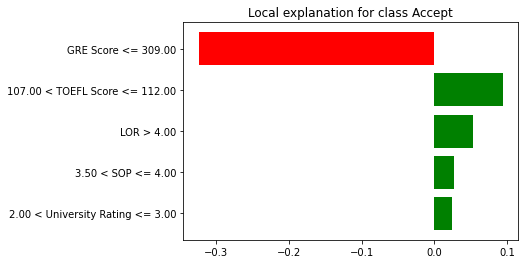
선택한 샘플에 대한 LIME의 특성 중요도 설명 이미지.

Python으로 배우는 Explainable AI

충실도 계산하기

X_instance['GRE Score'] = 310  


new_prediction = model.predict_proba(X_instance)[0, 1] print(f"Prediction after perturbing {important_feature}: {new_prediction}")
faithfulness_score = np.abs(original_prediction - new_prediction) print(f"Local Faithfulness Score: {faithfulness_score}")
Prediction after perturbing GRE Score: 0.77

Local Faithfulness Score: 0.34
Python으로 배우는 Explainable AI

연습해 봅시다!

Python으로 배우는 Explainable AI

Preparing Video For Download...