단순 선형 회귀

Python으로 배우는 시계열 분석

Rob Reider

Adjunct Professor, NYU-Courant Consultant, Quantopian

회귀란 무엇인가?

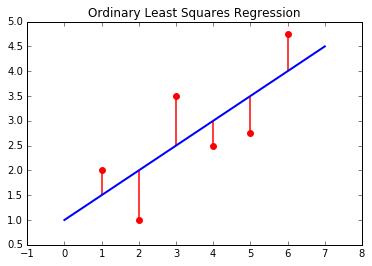
  • 단순 선형 회귀:

$\ \ \ \ y_t = \alpha + \beta x_t + \epsilon_t$

Python으로 배우는 시계열 분석

회귀란 무엇인가?

  • 최소자승법(OLS)
Python으로 배우는 시계열 분석

회귀 분석을 위한 Python 패키지

  • statsmodels 사용:
    import statsmodels.api as sm
    sm.OLS(y, x).fit()
    
  • numpy 사용:
    np.polyfit(x, y, deg=1)
    
  • pandas 사용:
    pd.ols(y, x)
    
  • scipy 사용:
    from scipy import stats
    stats.linregress(x, y)
    

주의: xy의 순서는 패키지마다 다를 수 있습니다

Python으로 배우는 시계열 분석

예제: 소형주 수익률의 대형주 수익률 회귀

  • statsmodels 모듈 임포트
    import statsmodels.api as sm
    
  • 두 시리즈의 퍼센트 변화율 계산
    df['SPX_Ret'] = df['SPX_Prices'].pct_change()
    df['R2000_Ret'] = df['R2000_Prices'].pct_change()
    
  • 회귀 절편을 위해 DataFrame에 상수 추가
    df = sm.add_constant(df)
    
Python으로 배우는 시계열 분석

회귀 예제 (계속)

  • 수익률 첫 번째 행이 NaN임을 확인
                SPX_Price  R2000_Price   SPX_Ret  R2000_Ret
    Date                                                     
    2012-11-01  1427.589966   827.849976       NaN        NaN
    2012-11-02  1414.199951   814.369995 -0.009379  -0.016283
    
  • NaN 행 삭제
      df = df.dropna()
    
  • 회귀 실행
      results = sm.OLS(df['R2000_Ret'],df[['const','SPX_Ret']]).fit()
      print(results.summary())
    
Python으로 배우는 시계열 분석

회귀 예제 (계속)

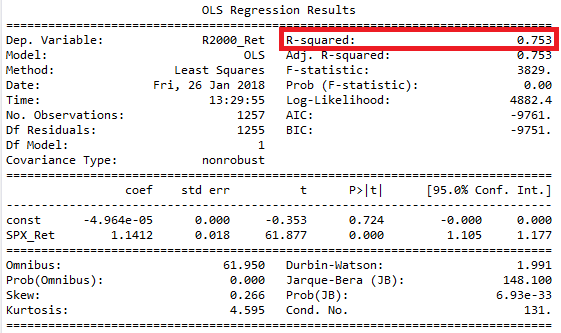
  • 회귀 출력

  • 절편: results.params[0]
  • 기울기: results.params[1]
Python으로 배우는 시계열 분석

회귀 예제 (계속)

  • 회귀 출력

Python으로 배우는 시계열 분석

R-제곱과 상관관계의 관계

  • $ [\text{corr} (x,y)]^2 = R^2$ (R-제곱)
  • $ \text{sign(corr)} = \text{sign(regression slope)}$
  • 앞선 예제:
    • R-제곱 = 0.753
    • 기울기는 양수
    • 상관계수 = $ + \sqrt{0.753} = 0.868$
Python으로 배우는 시계열 분석

실습해 봅시다!

Python으로 배우는 시계열 분석

Preparing Video For Download...