스펙트로그램 - 시간에 따른 스펙트럼 변화

Python으로 배우는 시계열 데이터 Machine Learning

Chris Holdgraf

Fellow, Berkeley Institute for Data Science

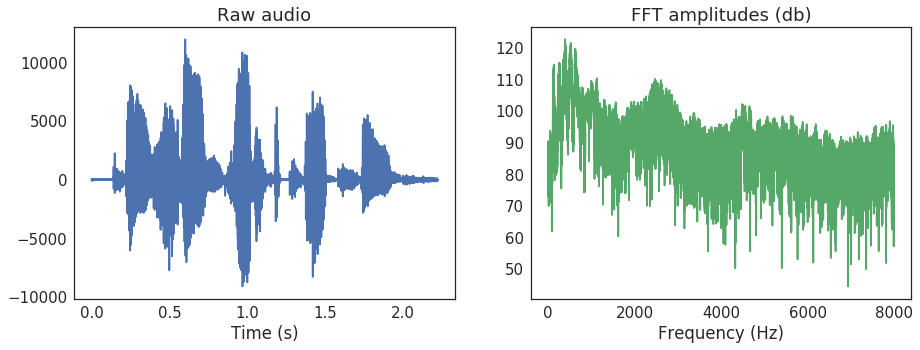
푸리에 변환

  • 시계열 데이터는 빠르게 변하는 성분과 느리게 변하는 성분의 조합으로 설명할 수 있습니다.
  • 각 시점에서 빠른 성분과 느린 성분의 상대적 비율을 나타낼 수 있습니다.
  • 이를 위한 가장 기본적인 방법이 푸리에 변환입니다.
  • 푸리에 변환은 하나의 시계열을 진동의 조합으로 표현하는 배열로 변환합니다.
Python으로 배우는 시계열 데이터 Machine Learning

푸리에 변환 (FFT)

Python으로 배우는 시계열 데이터 Machine Learning

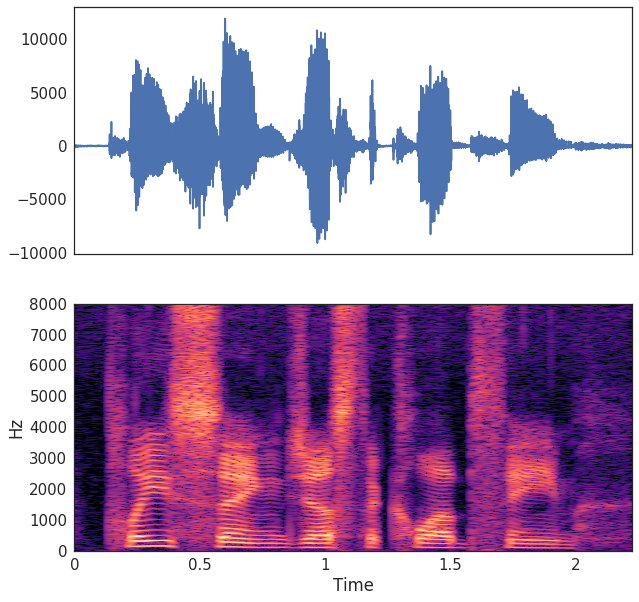
스펙트로그램: 윈도우 푸리에 변환의 조합

  • 스펙트로그램은 시간에 따른 윈도우 푸리에 변환의 집합입니다.
  • 롤링 평균 계산 방식과 유사합니다:
    1. 윈도우 크기와 형태를 선택합니다.
    2. 해당 시점에서 윈도우에 대한 FFT를 계산합니다.
    3. 윈도우를 한 칸 이동합니다.
    4. 결과를 집계합니다.
  • 단시간 푸리에 변환 (STFT)이라고 합니다.
Python으로 배우는 시계열 데이터 Machine Learning

Python으로 배우는 시계열 데이터 Machine Learning

STFT 계산하기

  • librosa를 사용하여 STFT를 계산할 수 있습니다.
  • 윈도우 크기 등 여러 매개변수를 조정할 수 있습니다.
  • 여기서는 모든 주파수의 평균값을 정규화하는 데시벨로 변환합니다.
  • 이후 specshow() 함수로 시각화할 수 있습니다.
Python으로 배우는 시계열 데이터 Machine Learning

코드로 STFT 계산하기

# Import the functions we'll use for the STFT
from librosa.core import stft, amplitude_to_db
from librosa.display import specshow
import matplotlib.pyplot as plt

# Calculate our STFT
HOP_LENGTH = 2**4
SIZE_WINDOW = 2**7
audio_spec = stft(audio, hop_length=HOP_LENGTH, n_fft=SIZE_WINDOW)

# Convert into decibels for visualization
spec_db = amplitude_to_db(audio_spec)

# Visualize
fig, ax = plt.subplots()
specshow(spec_db, sr=sfreq, x_axis='time', 
         y_axis='hz', hop_length=HOP_LENGTH, ax=ax)
Python으로 배우는 시계열 데이터 Machine Learning

스펙트럼 피처 엔지니어링

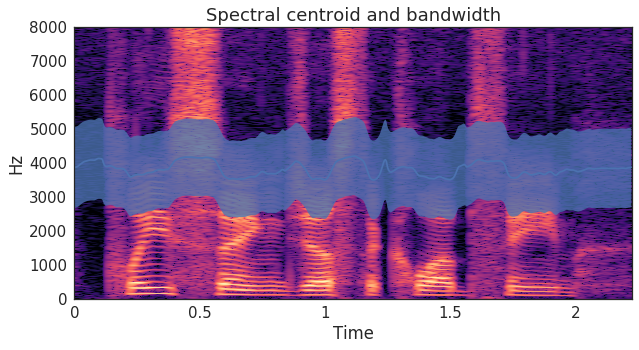
  • 각 시계열은 서로 다른 스펙트럼 패턴을 가집니다.
  • 스펙트로그램을 분석하여 이러한 스펙트럼 패턴을 계산할 수 있습니다.
  • 예를 들어, 스펙트럼 대역폭스펙트럼 중심은 각 시점에서 에너지가 집중된 위치를 나타냅니다.

Python으로 배우는 시계열 데이터 Machine Learning

스펙트럼 피처 계산하기

# Calculate the spectral centroid and bandwidth for the spectrogram
bandwidths = lr.feature.spectral_bandwidth(S=spec)[0]
centroids = lr.feature.spectral_centroid(S=spec)[0]

# Display these features on top of the spectrogram
fig, ax = plt.subplots()
specshow(spec, x_axis='time', y_axis='hz', hop_length=HOP_LENGTH, ax=ax)
ax.plot(times_spec, centroids)
ax.fill_between(times_spec, centroids - bandwidths / 2, 
                centroids + bandwidths / 2, alpha=0.5)
Python으로 배우는 시계열 데이터 Machine Learning

분류기에서 스펙트럼 및 시간적 피처 결합하기

centroids_all = []
bandwidths_all = []
for spec in spectrograms:
    bandwidths = lr.feature.spectral_bandwidth(S=lr.db_to_amplitude(spec))
    centroids = lr.feature.spectral_centroid(S=lr.db_to_amplitude(spec))
    # Calculate the mean spectral bandwidth
    bandwidths_all.append(np.mean(bandwidths))  
    # Calculate the mean spectral centroid
    centroids_all.append(np.mean(centroids))  

# Create our X matrix
X = np.column_stack([means, stds, maxs, tempo_mean, 
                     tempo_max, tempo_std, bandwidths_all, centroids_all])
Python으로 배우는 시계열 데이터 Machine Learning

연습해 봅시다!

Python으로 배우는 시계열 데이터 Machine Learning

Preparing Video For Download...