시계열 데이터 교차 검증

Python으로 배우는 시계열 데이터 Machine Learning

Chris Holdgraf

Fellow, Berkeley Institute for Data Science

scikit-learn을 활용한 교차 검증

# Iterating over the "split" method yields train/test indices
for tr, tt in cv.split(X, y):
    model.fit(X[tr], y[tr])
    model.score(X[tt], y[tt])
Python으로 배우는 시계열 데이터 Machine Learning

교차 검증 유형: KFold

  • KFold 교차 검증은 데이터를 동일한 크기의 여러 "폴드"로 분할합니다
  • 가장 널리 사용되는 교차 검증 방법 중 하나입니다

      from sklearn.model_selection import KFold
      cv = KFold(n_splits=5)
      for tr, tt in cv.split(X, y):
          ...
    
Python으로 배우는 시계열 데이터 Machine Learning

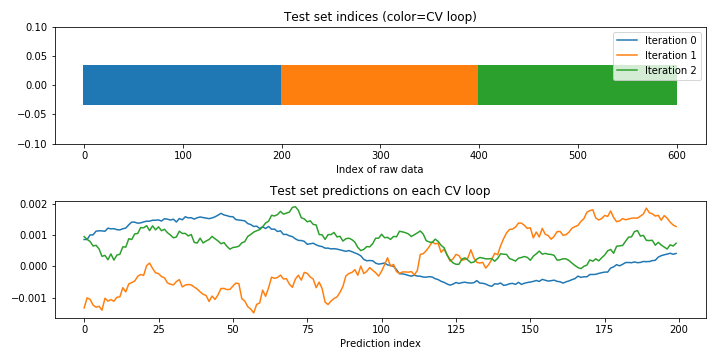
모델 예측 시각화

fig, axs = plt.subplots(2, 1)

# Plot the indices chosen for validation on each loop
axs[0].scatter(tt, [0] * len(tt), marker='_', s=2, lw=40)
axs[0].set(ylim=[-.1, .1], title='Test set indices (color=CV loop)', 
           xlabel='Index of raw data')

# Plot the model predictions on each iteration
axs[1].plot(model.predict(X[tt]))
axs[1].set(title='Test set predictions on each CV loop', 
           xlabel='Prediction index')
Python으로 배우는 시계열 데이터 Machine Learning

KFold CV 동작 시각화

Python으로 배우는 시계열 데이터 Machine Learning

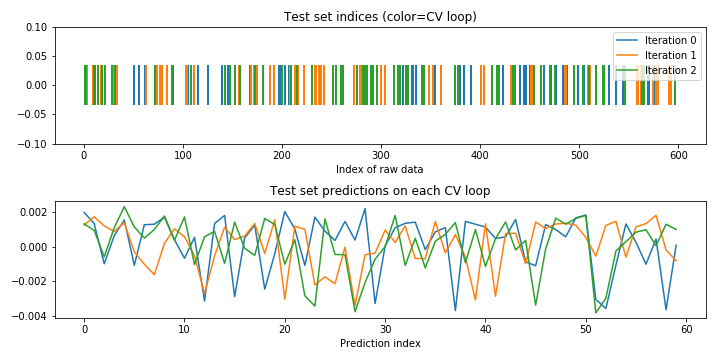
데이터 셔플 시 유의 사항

  • 많은 CV 반복자는 교차 검증 과정에서 데이터 셔플을 지원합니다.
  • 이는 데이터가 i.i.d.일 때만 유효하며, 시계열 데이터는 일반적으로 그렇지 않습니다.
  • 시계열 예측 시에는 데이터를 셔플하지 않아야 합니다.

      from sklearn.model_selection import ShuffleSplit
    
      cv = ShuffleSplit(n_splits=3)
      for tr, tt in cv.split(X, y):
          ...
    
Python으로 배우는 시계열 데이터 Machine Learning

셔플된 CV 동작 시각화

Python으로 배우는 시계열 데이터 Machine Learning

시계열 CV 반복자 사용

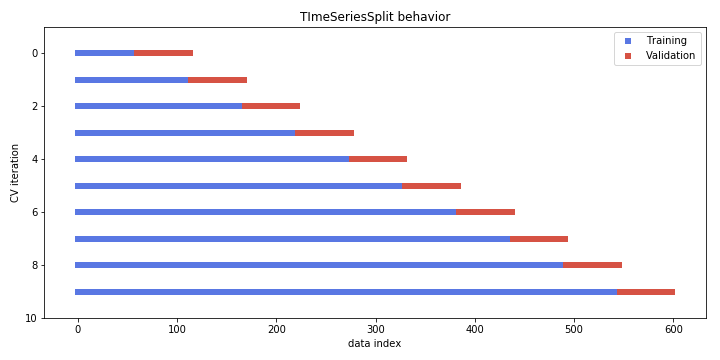
  • 지금까지 교차 검증에서 시간의 선형적 흐름을 무시했습니다
  • 그러나 일반적으로 미래 데이터를 사용해 과거를 예측해서는 안 됩니다
  • 권장 방법: 과거 훈련 데이터로 미래를 예측
Python으로 배우는 시계열 데이터 Machine Learning

시계열 교차 검증 반복자 시각화

# Import and initialize the cross-validation iterator
from sklearn.model_selection import TimeSeriesSplit
cv = TimeSeriesSplit(n_splits=10)

fig, ax = plt.subplots(figsize=(10, 5))
for ii, (tr, tt) in enumerate(cv.split(X, y)):
    # Plot training and test indices
    l1 = ax.scatter(tr, [ii] * len(tr), c=[plt.cm.coolwarm(.1)], 
                    marker='_', lw=6)
    l2 = ax.scatter(tt, [ii] * len(tt), c=[plt.cm.coolwarm(.9)], 
                    marker='_', lw=6)
    ax.set(ylim=[10, -1], title='TimeSeriesSplit behavior', 
           xlabel='data index', ylabel='CV iteration')
    ax.legend([l1, l2], ['Training', 'Validation'])
Python으로 배우는 시계열 데이터 Machine Learning

TimeSeriesSplit 교차 검증 반복자 시각화

Python으로 배우는 시계열 데이터 Machine Learning

scikit-learn의 사용자 정의 점수 함수

def myfunction(estimator, X, y):
    y_pred = estimator.predict(X)
    my_custom_score = my_custom_function(y_pred, y)
    return my_custom_score
Python으로 배우는 시계열 데이터 Machine Learning

scikit-learn용 사용자 정의 상관 함수

def my_pearsonr(est, X, y):
    # Generate predictions and convert to a vector 
    y_pred = est.predict(X).squeeze()

    # Use the numpy "corrcoef" function to calculate a correlation matrix
    my_corrcoef_matrix = np.corrcoef(y_pred, y.squeeze())

    # Return a single correlation value from the matrix
    my_corrcoef = my_corrcoef[1, 0]
    return my_corrcoef
Python으로 배우는 시계열 데이터 Machine Learning

연습해 봅시다!

Python으로 배우는 시계열 데이터 Machine Learning

Preparing Video For Download...