시간에 따른 피처 생성

Python으로 배우는 시계열 데이터 Machine Learning

Chris Holdgraf

Fellow, Berkeley Institute for Data Science

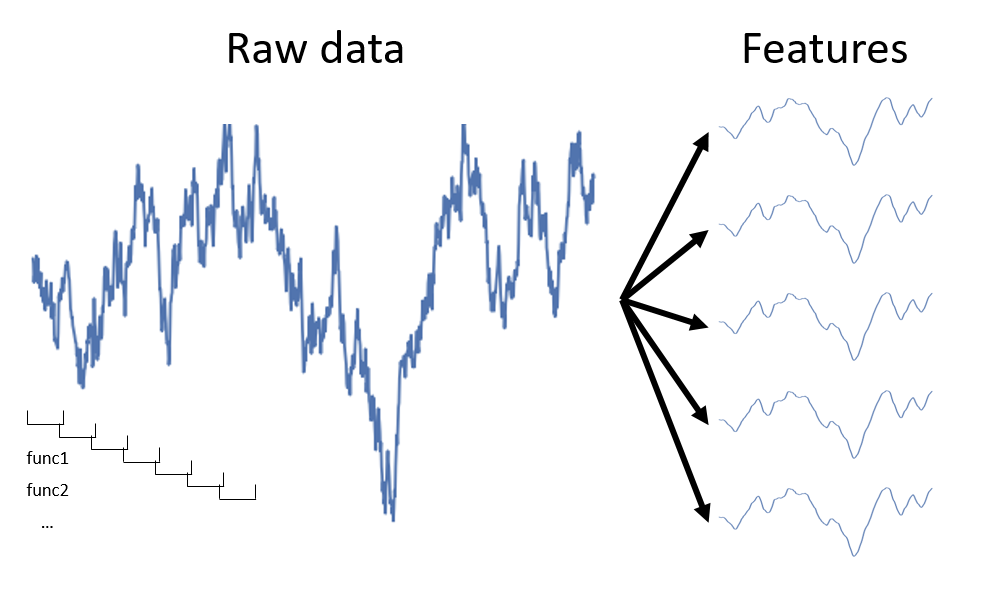
윈도우를 이용한 피처 추출

Python으로 배우는 시계열 데이터 Machine Learning

피처 추출에 .aggregate 사용하기

# Visualize the raw data
print(prices.head(3))
symbol            AIG        ABT
date                            
2010-01-04  29.889999  54.459951
2010-01-05  29.330000  54.019953
2010-01-06  29.139999  54.319953
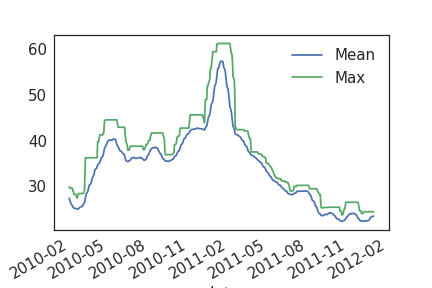
# Calculate a rolling window, then extract two features
feats = prices.rolling(20).aggregate([np.std, np.max]).dropna()
print(feats.head(3))
                 AIG                  ABT           
                 std       amax       std       amax
date                                                
2010-02-01  2.051966  29.889999  0.868830  56.239949
2010-02-02  2.101032  29.629999  0.869197  56.239949
2010-02-03  2.157249  29.629999  0.852509  56.239949
Python으로 배우는 시계열 데이터 Machine Learning

피처의 속성을 확인하세요!

Python으로 배우는 시계열 데이터 Machine Learning

Python에서 partial() 사용하기

# If we just take the mean, it returns a single value
a = np.array([[0, 1, 2], [0, 1, 2], [0, 1, 2]])
print(np.mean(a))
1.0
# We can use the partial function to initialize np.mean 
# with an axis parameter
from functools import partial
mean_over_first_axis = partial(np.mean, axis=0)

print(mean_over_first_axis(a))
[0. 1. 2.]
Python으로 배우는 시계열 데이터 Machine Learning

백분위수로 데이터 요약하기

  • 백분위수는 np.mean 대신 데이터를 더 세밀하게 요약하는 유용한 방법입니다
  • 주어진 데이터셋에서 N번째 백분위수는 데이터의 N%가 해당 값 아래에, 100-N%가 위에 있는 값입니다
print(np.percentile(np.linspace(0, 200), q=20))
40.0
Python으로 배우는 시계열 데이터 Machine Learning

np.percentile()와 partial 함수를 결합하여 다양한 백분위수 계산하기

data = np.linspace(0, 100)

# Create a list of functions using a list comprehension
percentile_funcs = [partial(np.percentile, q=ii) for ii in [20, 40, 60]]

# Calculate the output of each function in the same way
percentiles = [i_func(data) for i_func in percentile_funcs]
print(percentiles)
[20.0, 40.00000000000001, 60.0]
# Calculate multiple percentiles of a rolling window
data.rolling(20).aggregate(percentiles)
Python으로 배우는 시계열 데이터 Machine Learning

"날짜 기반" 피처 계산하기

  • 지금까지는 평균, 표준편차 등 데이터의 통계적 속성에 해당하는 "통계적" 피처에 집중했습니다
  • 그러나 시계열 데이터에는 요일, 공휴일 등 "인간적" 피처도 포함될 수 있습니다
  • 이러한 피처는 여러 해에 걸친 시계열 데이터(예: 주가 변동)를 다룰 때 유용합니다
Python으로 배우는 시계열 데이터 Machine Learning

Pandas를 이용한 datetime 피처 추출

# Ensure our index is datetime
prices.index = pd.to_datetime(prices.index)

# Extract datetime features
day_of_week_num = prices.index.weekday
print(day_of_week_num[:10])
Index([0 1 2 3 4 0 1 2 3 4], dtype='object')
day_of_week = prices.index.day_name()
print(day_of_week[:10])
Index(['Monday' 'Tuesday' 'Wednesday' 'Thursday' 'Friday' 'Monday' 'Tuesday'
 'Wednesday' 'Thursday' 'Friday'], dtype='object')
Python으로 배우는 시계열 데이터 Machine Learning

연습해 봅시다!

Python으로 배우는 시계열 데이터 Machine Learning

Preparing Video For Download...