데이터 정제 및 개선

Python으로 배우는 시계열 데이터 Machine Learning

Chris Holdgraf

Fellow, Berkeley Institute for Data Science

데이터는 지저분합니다

  • 실제 데이터는 지저분한 경우가 많습니다
  • 가장 흔한 문제는 결측값이상값입니다
  • 사람의 실수, 센서 오작동, 데이터베이스 오류 등이 원인입니다
  • 원시 데이터를 시각화하면 이런 문제를 쉽게 발견할 수 있습니다
Python으로 배우는 시계열 데이터 Machine Learning

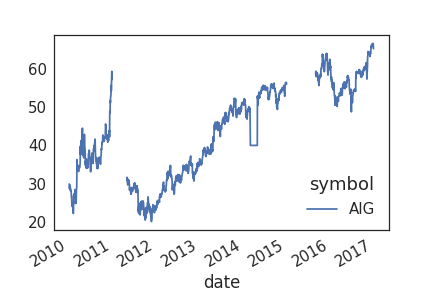
지저분한 데이터의 모습

Python으로 배우는 시계열 데이터 Machine Learning

보간: 시간을 이용한 결측값 채우기

  • 결측값을 처리하는 일반적인 방법은 보간입니다
  • 시계열 데이터에서는 시간을 활용하여 보간할 수 있습니다
  • 보간이란 데이터 공백 양쪽의 알려진 값을 사용해 결측값을 추정하는 것입니다
Python으로 배우는 시계열 데이터 Machine Learning

Pandas에서의 보간

# Return a boolean that notes where missing values are
missing = prices.isna()

# Interpolate linearly within missing windows
prices_interp = prices.interpolate('linear')

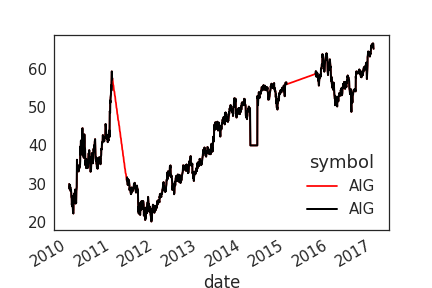
# Plot the interpolated data in red and the data w/ missing values in black
ax = prices_interp.plot(c='r')
prices.plot(c='k', ax=ax, lw=2)
Python으로 배우는 시계열 데이터 Machine Learning

보간된 데이터 시각화

Python으로 배우는 시계열 데이터 Machine Learning

롤링 윈도우를 이용한 데이터 변환

  • 롤링 윈도우의 또 다른 활용은 데이터 변환입니다
  • 이미 데이터를 평활화하는 데 한 번 사용했습니다
  • 더 복잡한 변환에도 활용할 수 있습니다
Python으로 배우는 시계열 데이터 Machine Learning

분산 표준화를 위한 데이터 변환

  • 데이터의 평균과 분산을 시간에 따라 표준화하는 변환이 자주 사용됩니다
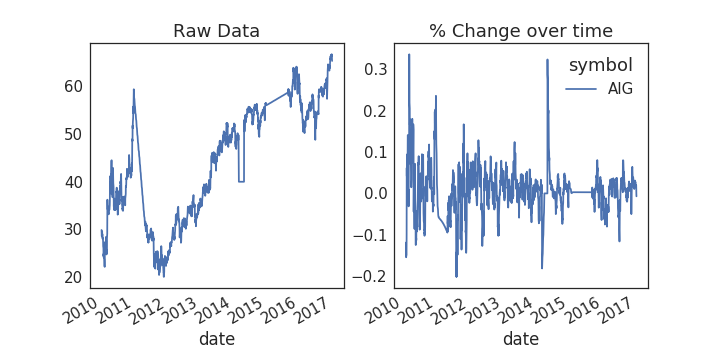
  • 여기서는 각 데이터 포인트를 이전 윈도우 대비 % 변화율로 변환하는 방법을 살펴봅니다
  • 절대값의 변동이 클 때 시점 간 비교를 용이하게 합니다
Python으로 배우는 시계열 데이터 Machine Learning

Pandas로 변화율 변환하기

def percent_change(values):
    """Calculates the % change between the last value 
    and the mean of previous values"""
    # Separate the last value and all previous values into variables
    previous_values = values[:-1]
    last_value = values[-1]

    # Calculate the % difference between the last value 
    # and the mean of earlier values
    percent_change = (last_value - np.mean(previous_values)) \
    / np.mean(previous_values)
    return percent_change
Python으로 배우는 시계열 데이터 Machine Learning

데이터에 적용하기

# Plot the raw data
fig, axs = plt.subplots(1, 2, figsize=(10, 5))
ax = prices.plot(ax=axs[0])

# Calculate % change and plot
ax = prices.rolling(window=20).aggregate(percent_change).plot(ax=axs[1])
ax.legend_.set_visible(False)
Python으로 배우는 시계열 데이터 Machine Learning

데이터에서 이상값 찾기

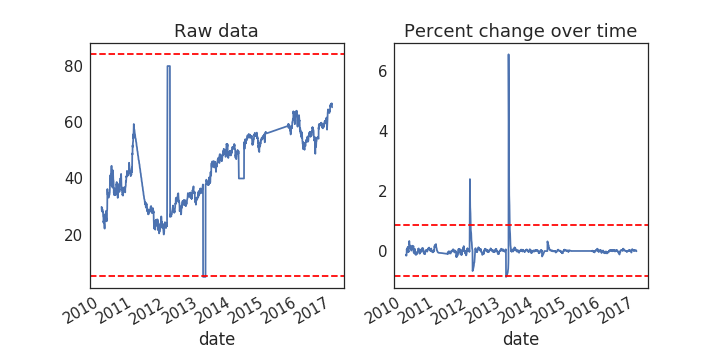
  • 이상값은 데이터셋에서 통계적으로 크게 벗어난 데이터 포인트입니다
  • 모델의 예측 성능에 부정적인 영향을 주어 '실제' 값에서 벗어나게 할 수 있습니다
  • 이상값을 제거하거나 더 대표적인 값으로 대체하는 방법이 있습니다

주의: 극단적인 실제 값과 이상값을 구별하기 어려운 경우가 많으므로 신중하게 처리하십시오

Python으로 배우는 시계열 데이터 Machine Learning

데이터에 임계값 표시하기

fig, axs = plt.subplots(1, 2, figsize=(10, 5))
for data, ax in zip([prices, prices_perc_change], axs):
    # Calculate the mean / standard deviation for the data
    this_mean = data.mean()
    this_std = data.std()

    # Plot the data, with a window that is 3 standard deviations 
    # around the mean
    data.plot(ax=ax)
    ax.axhline(this_mean + this_std * 3, ls='--', c='r')
    ax.axhline(this_mean - this_std * 3, ls='--', c='r')
Python으로 배우는 시계열 데이터 Machine Learning

이상값 임계값 시각화

Python으로 배우는 시계열 데이터 Machine Learning

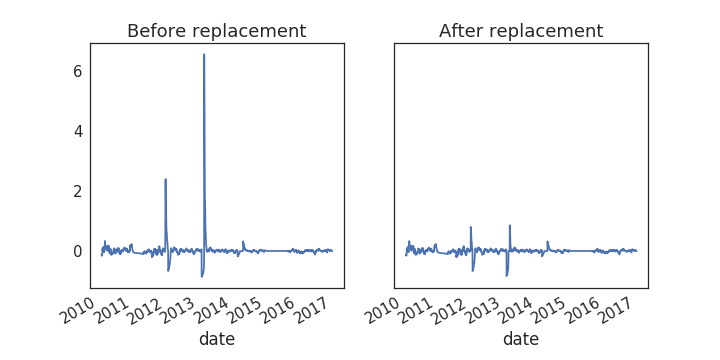
임계값을 이용한 이상값 대체

# Center the data so the mean is 0
prices_outlier_centered = prices_outlier_perc - prices_outlier_perc.mean()

# Calculate standard deviation
std = prices_outlier_perc.std()

# Use the absolute value of each datapoint 
# to make it easier to find outliers
outliers = np.abs(prices_outlier_centered) > (std * 3)

# Replace outliers with the median value
# We'll use np.nanmean since there may be nans around the outliers
prices_outlier_fixed = prices_outlier_centered.copy()
prices_outlier_fixed[outliers] = np.nanmedian(prices_outlier_fixed)

Python으로 배우는 시계열 데이터 Machine Learning

결과 시각화

fig, axs = plt.subplots(1, 2, figsize=(10, 5))
prices_outlier_centered.plot(ax=axs[0])
prices_outlier_fixed.plot(ax=axs[1])
Python으로 배우는 시계열 데이터 Machine Learning

연습해 봅시다!

Python으로 배우는 시계열 데이터 Machine Learning

Preparing Video For Download...