분류와 피처 엔지니어링

Python으로 배우는 시계열 데이터 Machine Learning

Chris Holdgraf

Fellow, Berkeley Institute for Data Science

모델 학습 전에 항상 원시 데이터를 시각화하세요

Python으로 배우는 시계열 데이터 Machine Learning

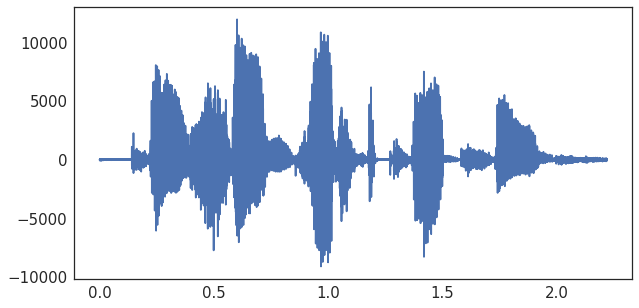
시계열 데이터 시각화하기!

ixs = np.arange(audio.shape[-1])
time = ixs / sfreq
fig, ax = plt.subplots()
ax.plot(time, audio)
Python으로 배우는 시계열 데이터 Machine Learning

어떤 피처를 사용할까요?

  • 원시 시계열 데이터는 분류에 사용하기에 너무 잡음이 많습니다
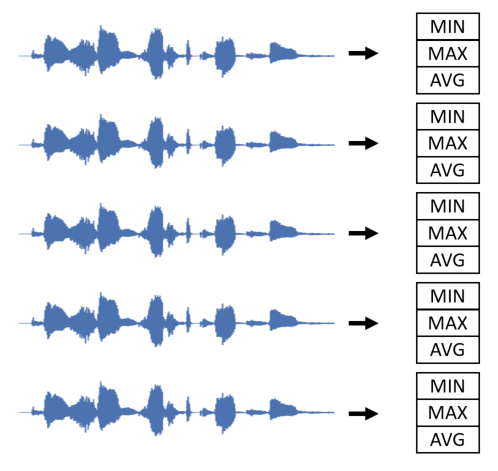
  • 피처를 계산해야 합니다!
  • 시작점: 오디오 데이터 요약하기
Python으로 배우는 시계열 데이터 Machine Learning

Python으로 배우는 시계열 데이터 Machine Learning

여러 피처 계산하기

print(audio.shape)
# (n_files, time)
(20, 7000) 
means = np.mean(audio, axis=-1)
maxs = np.max(audio, axis=-1)
stds = np.std(audio, axis=-1)

print(means.shape)
# (n_files,)
(20,) 
Python으로 배우는 시계열 데이터 Machine Learning

scikit-learn으로 분류기 학습하기

  • 2차원 데이터셋(샘플 × 시간)을 1차원 데이터셋(샘플)의 여러 피처로 축약했습니다
  • 각 피처를 결합하여 모델 입력으로 사용할 수 있습니다
  • 샘플에 레이블이 있다면 scikit-learn으로 분류기를 생성하고 학습시킬 수 있습니다
Python으로 배우는 시계열 데이터 Machine Learning

scikit-learn을 위한 피처 준비

# Import a linear classifier
from sklearn.svm import LinearSVC

# Note that means are reshaped to work with scikit-learn
X = np.column_stack([means, maxs, stds])
y = labels.reshape(-1, 1)
model = LinearSVC()
model.fit(X, y)
Python으로 배우는 시계열 데이터 Machine Learning

scikit-learn 모델 평가하기

from sklearn.metrics import accuracy_score

# Different input data
predictions = model.predict(X_test)  

# Score our model with % correct
# Manually
percent_score = sum(predictions == labels_test) / len(labels_test)  
# Using a sklearn scorer
percent_score = accuracy_score(labels_test, predictions)  
Python으로 배우는 시계열 데이터 Machine Learning

연습해 봅시다!

Python으로 배우는 시계열 데이터 Machine Learning

Preparing Video For Download...