정상성과 안정성

Python으로 배우는 시계열 데이터 Machine Learning

Chris Holdgraf

Fellow, Berkeley Institute for Data Science
정상성

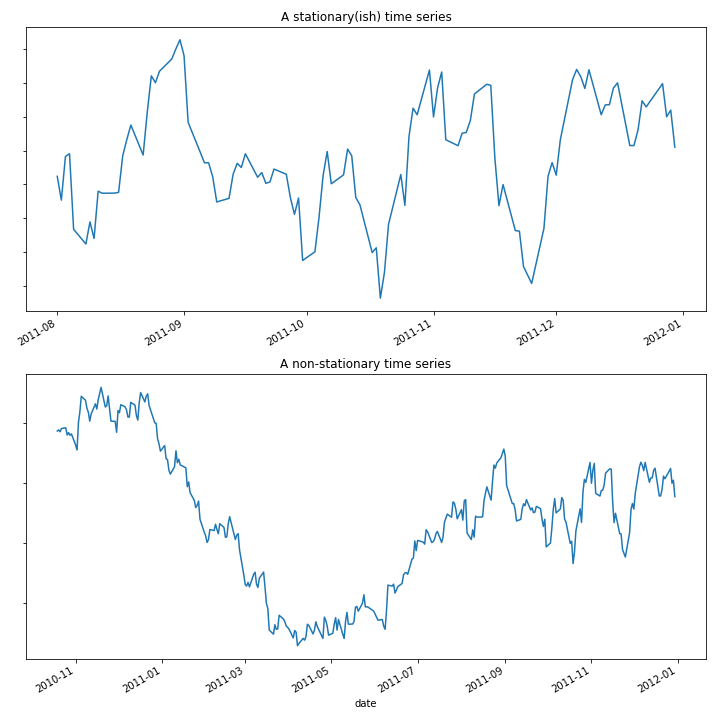
  • 정상 시계열은 통계적 특성이 시간에 따라 변하지 않습니다.
  • 예: 평균, 표준편차, 추세
  • 대부분의 시계열은 어느 정도 비정상성을 가집니다.
Python으로 배우는 시계열 데이터 Machine Learning

Python으로 배우는 시계열 데이터 Machine Learning

모델 안정성

  • 비정상 데이터는 모델에 변동성을 유발합니다.
  • 모델이 파악한 통계적 특성이 데이터에 따라 달라질 수 있습니다.
  • 또한 모델 파라미터의 정확한 값에 대한 불확실성이 커집니다.
  • 이를 어떻게 정량화할 수 있을까요?
Python으로 배우는 시계열 데이터 Machine Learning

파라미터 안정성 정량화를 위한 교차 검증

  • 한 가지 방법: 교차 검증 사용
  • 각 반복에서 모델 파라미터를 계산합니다.
  • 모든 CV 분할에 걸쳐 파라미터 안정성을 평가합니다.
Python으로 배우는 시계열 데이터 Machine Learning

평균의 부트스트래핑

  • 부트스트래핑은 변동성을 평가하는 일반적인 방법입니다.
  • 부트스트랩 절차:
    1. 복원 추출로 데이터를 무작위 샘플링합니다.
    2. 샘플의 평균을 계산합니다.
    3. 이 과정을 수천 번 반복합니다.
    4. 결과의 백분위수를 계산합니다 (보통 2.5, 97.5).

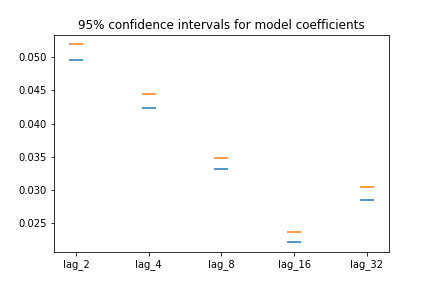
결과는 각 계수 평균의 95% 신뢰구간입니다.

Python으로 배우는 시계열 데이터 Machine Learning

평균의 부트스트래핑

from sklearn.utils import resample

# cv_coefficients has shape (n_cv_folds, n_coefficients)
n_boots = 100
bootstrap_means = np.zeros(n_boots, n_coefficients)
for ii in range(n_boots):
    # Generate random indices for our data with replacement, 
    # then take the sample mean
    random_sample = resample(cv_coefficients)
    bootstrap_means[ii] = random_sample.mean(axis=0)

# Compute the percentiles of choice for the bootstrapped means
percentiles = np.percentile(bootstrap_means, (2.5, 97.5), axis=0)
Python으로 배우는 시계열 데이터 Machine Learning

부트스트래핑된 계수 시각화

fig, ax = plt.subplots()
ax.scatter(many_shifts.columns, percentiles[0], marker='_', s=200)
ax.scatter(many_shifts.columns, percentiles[1], marker='_', s=200)
Python으로 배우는 시계열 데이터 Machine Learning

모델 성능 안정성 평가

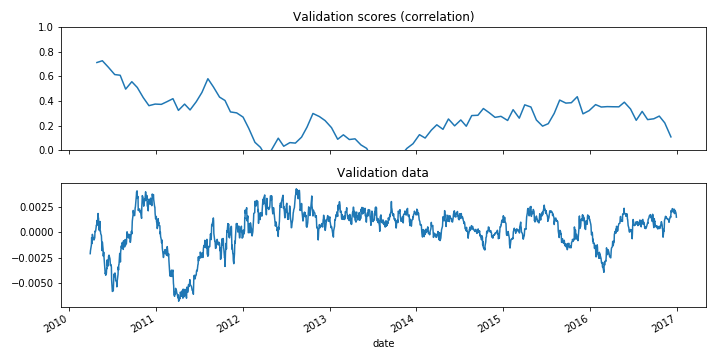
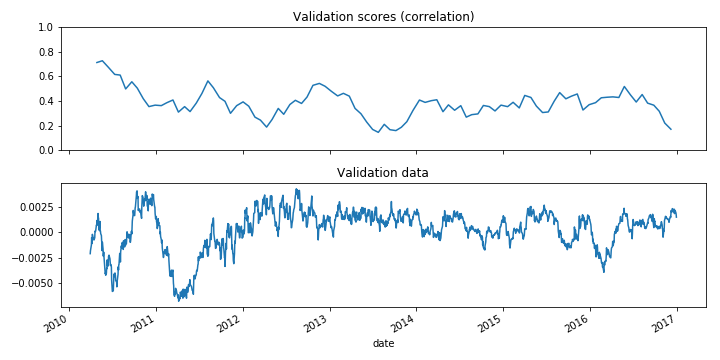
  • TimeSeriesSplit 사용 시 시간에 따른 모델 점수를 시각화할 수 있습니다.
  • 점수를 저하시키는 특정 시간 구간을 찾는 데 유용합니다.
  • 비정상 신호를 발견하는 데도 유용합니다.
Python으로 배우는 시계열 데이터 Machine Learning

시간에 따른 모델 성능

def my_corrcoef(est, X, y):
    """Return the correlation coefficient 
    between model predictions and a validation set."""
    return np.corrcoef(y, est.predict(X))[1, 0]

# Grab the date of the first index of each validation set
first_indices = [data.index[tt[0]] for tr, tt in cv.split(X, y)]

# Calculate the CV scores and convert to a Pandas Series
cv_scores = cross_val_score(model, X, y, cv=cv, scoring=my_corrcoef)
cv_scores = pd.Series(cv_scores, index=first_indices)
Python으로 배우는 시계열 데이터 Machine Learning

모델 점수를 시계열로 시각화

fig, axs = plt.subplots(2, 1, figsize=(10, 5), sharex=True)

# Calculate a rolling mean of scores over time
cv_scores_mean = cv_scores.rolling(10, min_periods=1).mean()
cv_scores.plot(ax=axs[0])
axs[0].set(title='Validation scores (correlation)', ylim=[0, 1])

# Plot the raw data
data.plot(ax=axs[1])
axs[1].set(title='Validation data')
Python으로 배우는 시계열 데이터 Machine Learning

모델 점수 시각화

Python으로 배우는 시계열 데이터 Machine Learning

시계열 교차 검증의 고정 윈도우

# Only keep the last 100 datapoints in the training data
window = 100

# Initialize the CV with this window size
cv = TimeSeriesSplit(n_splits=10, max_train_size=window)
Python으로 배우는 시계열 데이터 Machine Learning

비정상 신호

Python으로 배우는 시계열 데이터 Machine Learning

연습해 봅시다!

Python으로 배우는 시계열 데이터 Machine Learning

Preparing Video For Download...