클러스터 분석 기초

Python으로 배우는 군집 분석

Shaumik Daityari

Business Analyst

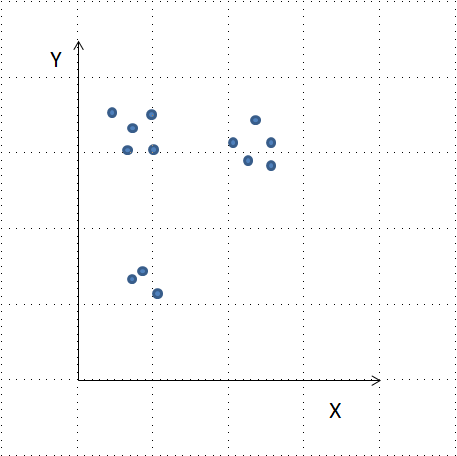
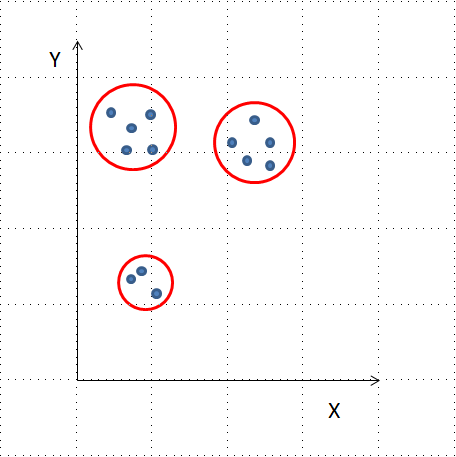
클러스터란?

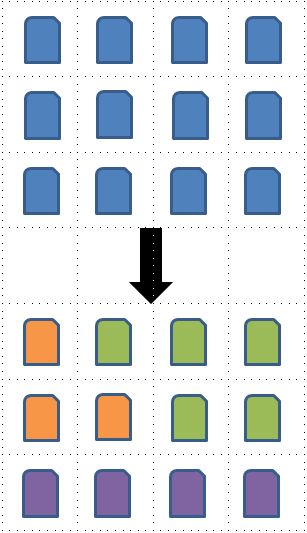
  • 유사 특성을 가진 항목들의 집합
  • Google 뉴스: 유사한 단어와 연관이 함께 나타나는 기사
  • 고객 세그먼트

Python으로 배우는 군집 분석

클러스터링 알고리즘

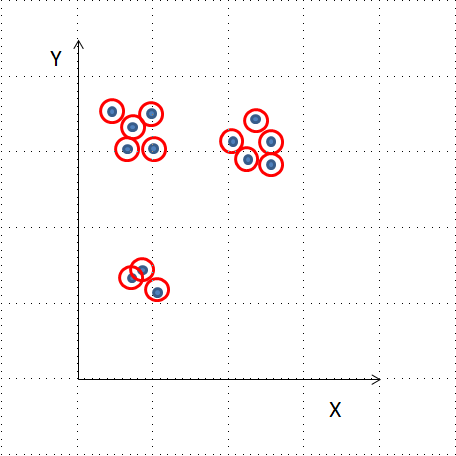
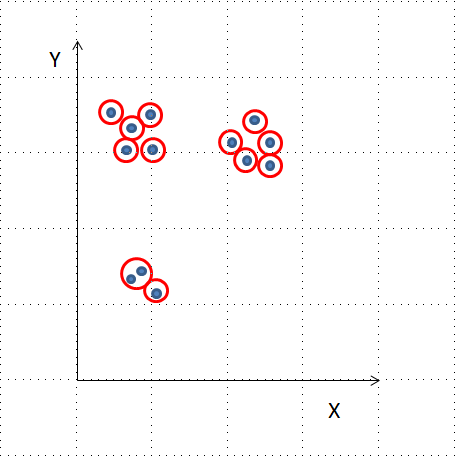
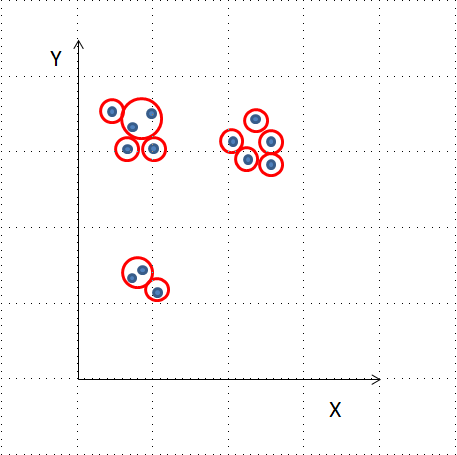
  • 계층적 클러스터링
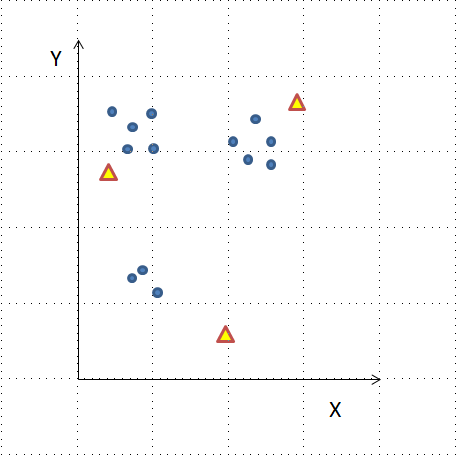
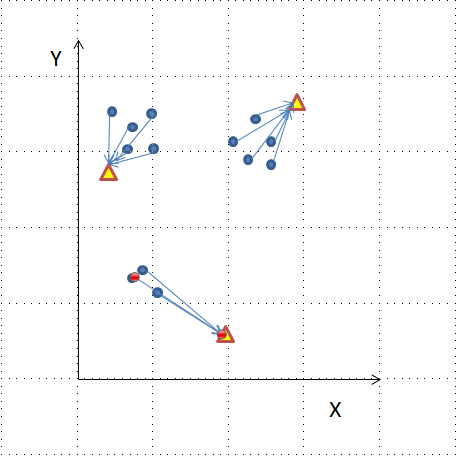
  • K-평균 클러스터링
  • 기타 알고리즘: DBSCAN, 가우시안 방법
Python으로 배우는 군집 분석

Python으로 배우는 군집 분석

Python으로 배우는 군집 분석

Python으로 배우는 군집 분석

Python으로 배우는 군집 분석

Python으로 배우는 군집 분석

SciPy로 계층적 클러스터링

from scipy.cluster.hierarchy import linkage, fcluster
from matplotlib import pyplot as plt
import seaborn as sns, pandas as pd
x_coordinates = [80.1, 93.1, 86.6, 98.5, 86.4, 9.5, 15.2, 3.4, 
                 10.4, 20.3, 44.2, 56.8, 49.2, 62.5, 44.0]
y_coordinates = [87.2, 96.1, 95.6, 92.4, 92.4, 57.7, 49.4, 
                 47.3, 59.1, 55.5, 25.6, 2.1, 10.9, 24.1, 10.3]

df = pd.DataFrame({'x_coordinate': x_coordinates,
                   'y_coordinate': y_coordinates})
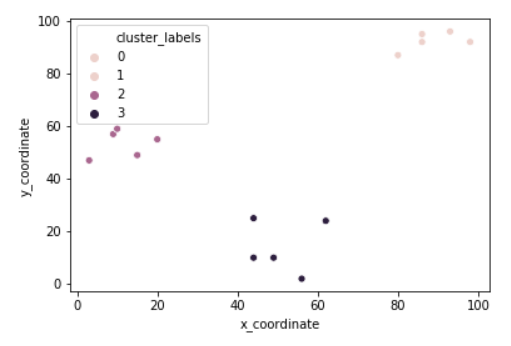
Z = linkage(df, 'ward')
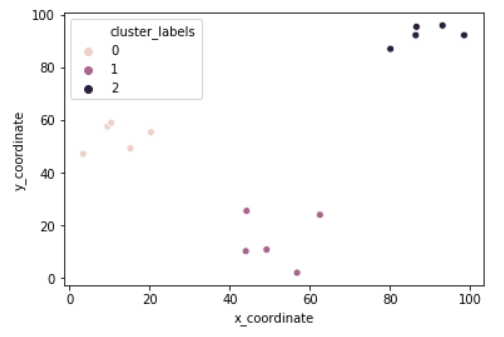
df['cluster_labels'] = fcluster(Z, 3, criterion='maxclust')
sns.scatterplot(x='x_coordinate', y='y_coordinate', 
                hue='cluster_labels', data = df)
plt.show()
Python으로 배우는 군집 분석

Python으로 배우는 군집 분석

Python으로 배우는 군집 분석

Python으로 배우는 군집 분석

Python으로 배우는 군집 분석

Python으로 배우는 군집 분석

SciPy로 K-평균 클러스터링

from scipy.cluster.vq import kmeans, vq
from matplotlib import pyplot as plt
import seaborn as sns, pandas as pd

import random
random.seed((1000,2000))
x_coordinates = [80.1, 93.1, 86.6, 98.5, 86.4, 9.5, 15.2, 3.4, 
                 10.4, 20.3, 44.2, 56.8, 49.2, 62.5, 44.0]
y_coordinates = [87.2, 96.1, 95.6, 92.4, 92.4, 57.7, 49.4, 
                 47.3, 59.1, 55.5, 25.6, 2.1, 10.9, 24.1, 10.3]

df = pd.DataFrame({'x_coordinate': x_coordinates, 'y_coordinate': y_coordinates})
centroids,_ = kmeans(df, 3)
df['cluster_labels'], _ = vq(df, centroids)
sns.scatterplot(x='x_coordinate', y='y_coordinate', 
                hue='cluster_labels', data = df)
plt.show()
Python으로 배우는 군집 분석

Python으로 배우는 군집 분석

다음: 실습 문제

Python으로 배우는 군집 분석

Preparing Video For Download...